Import RD signal for each sample from bam/sam/cram file and calculate histograms with specified bin size. It can be any positive integer divisible by 100. We use 100000 in this example
> cnvpytor -root sample.pytor -rd sample.bam
> cnvpytor -root sample.pytor -his 100000
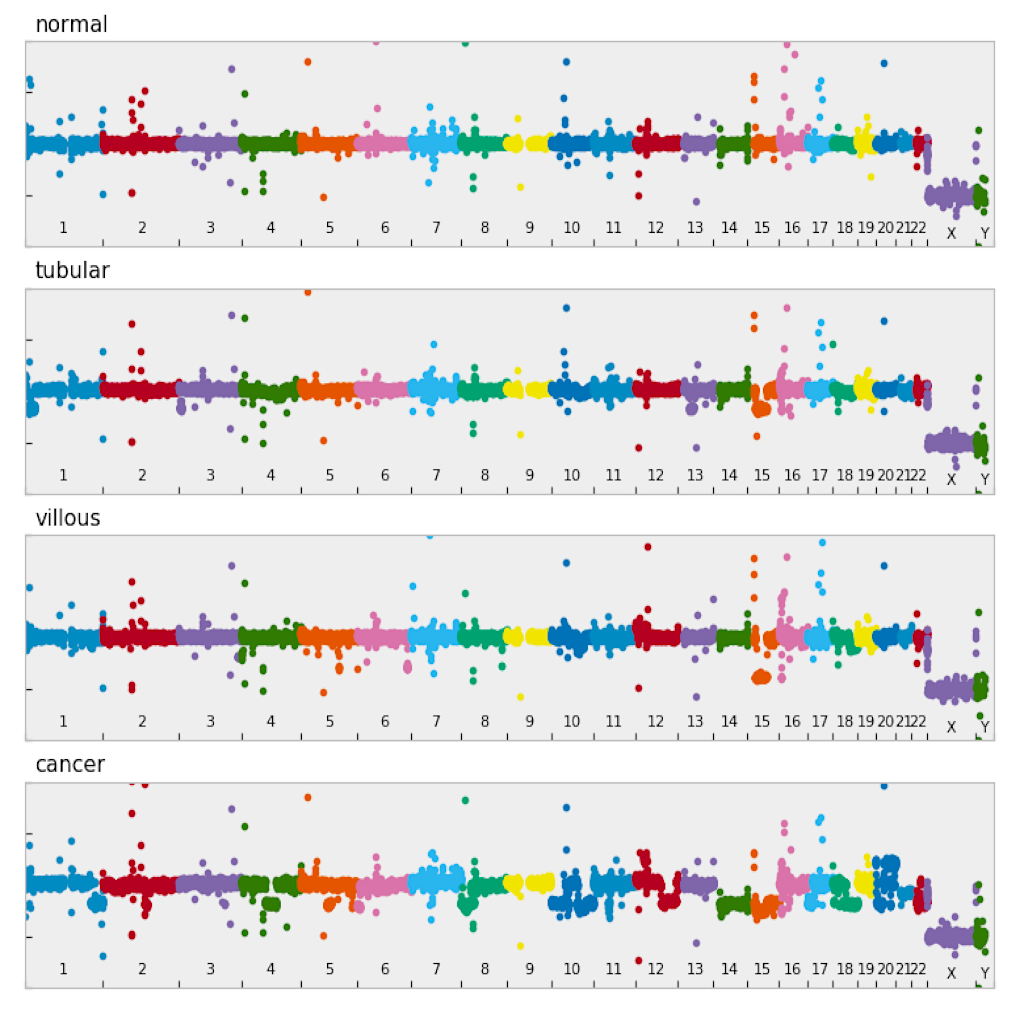
Enter interactive plotting mode with all sample you want to plot listed:
> cnvpytor -root sample1.pytor sample2.pytor sample3.pytor sample4.pytor -view 100000

cnvpytor> set style bmh
cnvpytor> set rd_use_mask
cnvpytor> set file_titles normal tubular villous cancer
cnvpytor> manhattan
cnvpytor> save image.png
cnvpytor> quit
By pressing tab two times after typing 'set style ' you will got list of all available styles.
If you skip third line (set file_titles) file names will be used for subplot title.
Instead 'quit' CTRL+D can be used.
In this example we used data from following article:
[1] Oncotarget 2017 Dec 26;9(6):6780-6792. doi: 10.18632/oncotarget.23687
Inferring modes of evolution from colorectal cancer with residual polyp of origin.
Kim M, Druliner BR, Vasmatzis N, Bae T, Chia N, Abyzov A, Boardman LA.