-
-
Notifications
You must be signed in to change notification settings - Fork 1
/
Copy pathday18_water.py
153 lines (135 loc) · 5.51 KB
/
day18_water.py
1
2
3
4
5
6
7
8
9
10
11
12
13
14
15
16
17
18
19
20
21
22
23
24
25
26
27
28
29
30
31
32
33
34
35
36
37
38
39
40
41
42
43
44
45
46
47
48
49
50
51
52
53
54
55
56
57
58
59
60
61
62
63
64
65
66
67
68
69
70
71
72
73
74
75
76
77
78
79
80
81
82
83
84
85
86
87
88
89
90
91
92
93
94
95
96
97
98
99
100
101
102
103
104
105
106
107
108
109
110
111
112
113
114
115
116
117
118
119
120
121
122
123
124
125
126
127
128
129
130
131
132
133
134
135
136
137
138
139
140
141
142
143
144
145
146
147
148
149
150
151
152
153
# -*- coding: utf-8 -*-
# ---
# jupyter:
# jupytext:
# formats: ipynb,py:hydrogen
# text_representation:
# extension: .py
# format_name: hydrogen
# format_version: '1.3'
# jupytext_version: 1.9.1
# kernelspec:
# display_name: Python 3 (ipykernel)
# language: python
# name: python3
# ---
# %% [markdown]
# # Day 18 : Water
#
# Oceans, lakes, rivers or something completely different.
# %%
import zipfile
import pygmt
import rioxarray.merge
import xarray as xr
# %% [markdown]
# ## Download NZ 10m Satellite Imagery (2020-2021)
#
# Getting some seamless cloud-free 10m resolution satellite imagery of
# New Zealand, captured by the European Space Agency Sentinel-2 satellites
# between September 2020 - April 2021.
#
# Link to the data at LINZ Data Service (LDS):
# - https://data.linz.govt.nz/layer/106279-nz-10m-satellite-imagery-2020-2021
#
# Specfically, we'll get two specific tiles covering
# [Aoraki/Mount Cook National Park](https://en.wikipedia.org/wiki/Aoraki_/_Mount_Cook_National_Park)
# in the South Island of New Zealand.
# - [BX15](https://data.linz.govt.nz/layer/106279-nz-10m-satellite-imagery-2020-2021/data/260/?mt=Satellite&l=106279%3A40%2C104735%3A0%2C103539%3A0%2C93652%3A0&lpw=650&cv=1&z=10&c=-43.57643%2C170.32402&e=0&al=m&lag_f=*&lag_q=BX15)
# - [BX16](https://data.linz.govt.nz/layer/106279-nz-10m-satellite-imagery-2020-2021/data/279/?mt=Satellite&l=106279%3A40%2C104735%3A0%2C103539%3A0%2C93652%3A0&lpw=650&cv=1&z=10&c=-43.57643%2C170.32402&e=0&al=m&lag_f=*&lag_q=BX16)
#
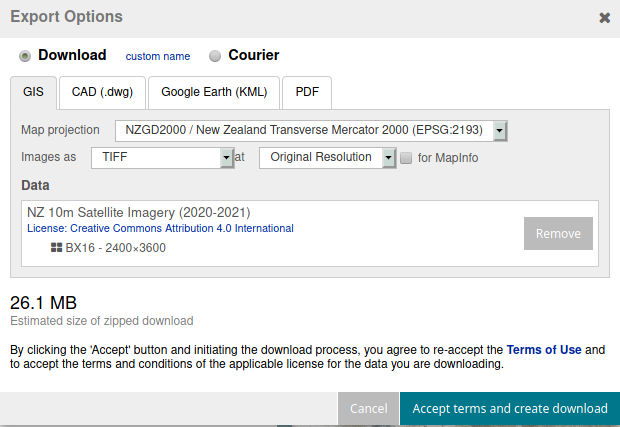
# You'll need to manually create a LINZ Data Service account, login, and
# download a zipped GeoTIFF. Choose the default EPSG:2193 projection,
# 'TIFF' as the image option, and 'Original Resolution'.
#
# 
# %%
# Unzip the files
for file in ["lds-tile-bx15-GTiff.zip", "lds-tile-bx16-GTiff.zip"]:
with zipfile.ZipFile(file=file) as z:
for zip_info in z.infolist():
z.extract(member=zip_info)
# %%
# Merge the two GeoTIFFs together into a single dataarray
rda1 = rioxarray.open_rasterio(filename="BX15.tif")
rda2 = rioxarray.open_rasterio(filename="BX16.tif")
rda = rioxarray.merge.merge_arrays(dataarrays=[rda1, rda2])
# %%
# Clip RGB aerial imagery to geographical extent of Aoraki
rda_clipped = rda.rio.clip_box(
# minx=1_348_000, maxx=1_396_000, miny=5_154_000, maxy=5_190_000
minx=1_360_000,
maxx=1_390_000,
miny=5_155_000,
maxy=5_190_000,
)
rda_clipped.rio.to_raster(raster_path="BX15-16.tif", dtype="uint8")
# %%
# Inspect the metadata of the merged GeoTIFF file
print(pygmt.grdinfo(grid="BX15-16.tif"))
# %% [markdown]
# ## Get DEM and reproject/clip to area of interest
#
# We'll get some 1 arc-second Digital Elevation Model from SRTM1S using
# [`pygmt.datasets.load_earth_relief`](https://www.pygmt.org/v0.5.0/api/generated/pygmt.datasets.load_earth_relief.html)
# for our area of interest over Aoraki. Note that we provide the geographical
# bounding box coordinates, and get a WGS84/EPSG:4326 xarray.DataArray back.
#
# The raster grid is reprojected to NZTM/EPSG:2193 using `rioxarray`, and we
# clip things a bit to remove NaNs on the edges, and also to focus the view
# solely on the mountainous areas.
# %%
# Download 1 arc-second SRTM1S DEM
dem_wgs84: xr.DataArray = pygmt.datasets.load_earth_relief(
resolution="01s", region=[169.8, 170.5, -43.8, -43.3]
)
# %%
# Reproject from EPSG:4326 to EPSG:2193
dem_wgs84.rio.set_crs(input_crs="EPSG:4326")
dem_grid = dem_wgs84.rio.reproject(dst_crs="EPSG:2193", resolution=25)
# %%
# Clip the raster to our region of interest
dem_grid_clipped = dem_grid.rio.clip_box(
# minx=1_348_000, maxx=1_396_000, miny=5_154_000, maxy=5_190_000
minx=1_360_000,
maxx=1_390_000,
miny=5_155_000,
maxy=5_190_000,
)
dem_grid_clipped = dem_grid_clipped.astype(dtype="int16")
dem_grid_clipped.rio.to_raster(raster_path="dem_grid.tif", dtype="int16")
# %%
# Inspect the metadata of the GeoTIFF file
print(pygmt.grdinfo(grid="dem_grid.tif"))
# %% [markdown]
# ## Plot the map!
#
# Let's make a 3D perspective map using PyGMT's
# [`grdview`](https://www.pygmt.org/v0.5.0/api/generated/pygmt.Figure.grdview.html).
# The DEM is used as the relief grid, and draped on top is the satellite
# imagery. We'll also add some shading to the raster grid (see
# [`pygmt.grdgradient`](https://www.pygmt.org/v0.5.0/api/generated/pygmt.grdgradient.html)
# for more information) so that the colours stand out more. Finally, we'll add
# a title using [`text`](https://www.pygmt.org/v0.5.0/api/generated/pygmt.Figure.text.html)
# using a fancy font from the list of standard fonts provided by GMT at
# https://docs.generic-mapping-tools.org/6.2/cookbook/postscript-fonts.html.
# %%
fig = pygmt.Figure()
with pygmt.config(PS_PAGE_COLOR="black"):
fig.grdview(
grid="dem_grid.tif", # Digital Surface Elevation model
drapegrid="BX15-16.tif", # Satellite imagery layer
shading=True, # use default intensity shading
# region=[1_348_000, 1_396_000, 5_154_000, 5_190_000],
region=[1_360_000, 1_390_000, 5_155_000, 5_190_000],
surftype="i450", # image draping with 450dpi resolution
perspective=[190, 20], # view azimuth and angle
zscale="0.001", # vertical exaggeration
)
fig.text(
position="ML", # middle left
text="Aoraki / Mount Cook National Park",
font="18p,ZapfChancery-MediumItalic,white",
)
fig.savefig(fname="day18_water.png", dpi=450)
fig.show()