-
-
Notifications
You must be signed in to change notification settings - Fork 1
/
Copy pathday16_urban.py
98 lines (86 loc) · 3.5 KB
/
day16_urban.py
1
2
3
4
5
6
7
8
9
10
11
12
13
14
15
16
17
18
19
20
21
22
23
24
25
26
27
28
29
30
31
32
33
34
35
36
37
38
39
40
41
42
43
44
45
46
47
48
49
50
51
52
53
54
55
56
57
58
59
60
61
62
63
64
65
66
67
68
69
70
71
72
73
74
75
76
77
78
79
80
81
82
83
84
85
86
87
88
89
90
91
92
93
94
95
96
97
98
# -*- coding: utf-8 -*-
# ---
# jupyter:
# jupytext:
# formats: ipynb,py:hydrogen
# text_representation:
# extension: .py
# format_name: hydrogen
# format_version: '1.3'
# jupytext_version: 1.9.1
# kernelspec:
# display_name: Python 3 (ipykernel)
# language: python
# name: python3
# ---
# %% [markdown]
# # Day 16 : Urban/Rural
#
# Map an urban area or rural area. Or something that defines that place.
# %%
import zipfile
import pygmt
# %% [markdown]
# ## Download Wellington City Urban Aerial Photos
#
# Getting some Orthophotography of urban areas within Wellington City taken in
# the flying season (austral summer period). We'll compare imagery taken 8 years
# apart - an older 10cm spatial resolution image from 2012/2013 and a newer
# 7.5cm spatial resolution image from 2020/2021.
#
# Links to the data at LINZ Data Service (LDS):
# - https://data.linz.govt.nz/layer/105744-wellington-city-0075m-urban-aerial-photos-2021
# - https://data.linz.govt.nz/layer/51871-wellington-01m-urban-aerial-photos-2012-2013
#
# Specfically, we'll get a specific tile which covers a section of
# [Cuba Street](https://www.wellingtonnz.com/visit/cuba-street) in Te Aro,
# one of the coolest parts of Wellington!
# - [BQ31_500_041070](https://data.linz.govt.nz/layer/105744-wellington-city-0075m-urban-aerial-photos-2021/data/504/?mt=Streets&l=105749%2C105744%3A0&lpw=650&cv=0&z=17&c=-41.29187%2C174.77743&e=0&al=m&lag_f=*&lag_q=BQ31_500_041070) from 2020/2021
# - [BQ31_041070](https://data.linz.govt.nz/layer/51871-wellington-01m-urban-aerial-photos-2012-2013/data/72/?mt=Streets&l=51871&lpw=650&cv=0&z=15&c=-41.29422%2C174.77575&e=0&al=m&lag_f=*&lag_q=BQ31_041070) from 2012/2013
#
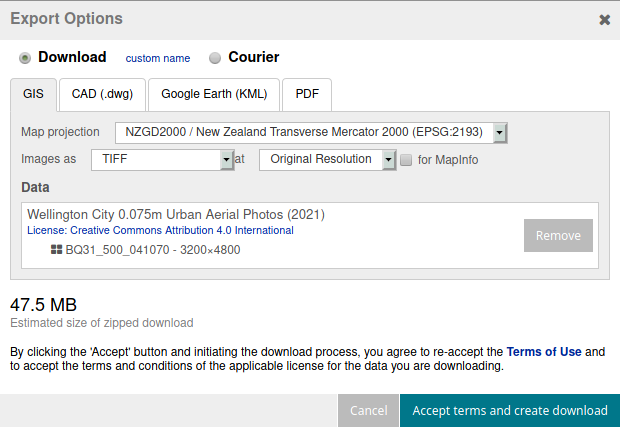
# You'll need to manually create a LINZ Data Service account, login, and
# download a zipped GeoTIFF. Choose the default EPSG:2193 projection,
# 'TIFF' as the image option, and 'Original Resolution'.
#
# 
# %%
# Unzip the files
for file in ["lds-tile-bq31-500-041070-GTiff.zip", "lds-tile-bq31-041070-GTiff.zip"]:
with zipfile.ZipFile(file=file) as z:
for zip_info in z.infolist():
z.extract(member=zip_info)
# %%
# Inspect the metadata of the GeoTIFF files
print(pygmt.grdinfo(grid="BQ31_500_041070.tif"))
print(pygmt.grdinfo(grid="BQ31_041070.tif"))
# %% [markdown]
# ## Plot the map!
#
# Let's plot the two images side by side using
# [pygmt.Figure.subplot](https://www.pygmt.org/v0.5.0/api/generated/pygmt.Figure.subplot.html)
# and [pygmt.Figure.set_panel](https://www.pygmt.org/v0.5.0/api/generated/pygmt.Figure.set_panel.html)
# (see tutorial at https://www.pygmt.org/v0.5.0/tutorials/subplots.html).
# The RGB GeoTIFFs are plotted using the
# [`grdimage`](https://www.pygmt.org/v0.5.0/api/generated/pygmt.Figure.grdimage.html)
# function.
# %%
import pygmt
# %%
fig = pygmt.Figure()
with pygmt.config(FONT_TAG="AvantGarde-Demi,225/221/0"):
with fig.subplot(
ncols=2,
subsize=("8c", "12c"),
autolabel=True,
sharex="b",
sharey="r",
frame=["lEtS", "xa100f", "yaf"],
):
# Plot 2012/2013 image on the left
with fig.set_panel(panel=0, fixedlabel="2012/2013"):
fig.grdimage(grid="BQ31_041070.tif")
# Plot 2020/2021 image on the right
with fig.set_panel(panel=1, fixedlabel="2020/2021"):
fig.grdimage(grid="BQ31_500_041070.tif")
# fig.savefig(fname="day16_urban.png")
fig.show()