Frequently_Asked_Questions
On most clusters, a difference is being made between repositories designed to IO-intensive computations (hot storage), and repositories designed to archive (cold storage). Locally, system administrators allow (or not) the users to compute on archive-designed repositories.
Yet, copying all your fastq files at once before starting to work is time consuming and requires two copies of all your fastq files at the beginning of your work. Let Snakemake handle both copy creation and removal. This will save you time!
You should not. I am very happy to improve myself, this code, and to help you get more confidence in yourself. You have found a mistake? Open an issue. CHEERS and THANK YOU!
You can open an issue, or fork this git repository, and make your own path. You are likely to have very good reasons to do so. Who knows, maybe you'll make a pull request?
This error is not related to the pipeline itself, but with your use of Snakemake. This issue is raised because too much time was required for the queue you specified.
Your command line looks like : --qsub --time={resources.time} --mem={resources.mem_mb}
The time provided by the pipeline through the argument --time is too high for the queue YOU specified. Your command line should look like: --qsub --time={resources.time} --mem={resources.mem_mb} -p mediumq
Or else, you could use a profile! Snakemake profile allows to choose automatically the best queue! If you are in Gustave Roussy Institute, then look at: slurm.
-Values and Q-Values are metrics used to rank observation from 0 (effective difference) to 1 (purely random observation). A Q-Value is a P-Value adjusted using an optimized FDR (False Discovery Rate) approach.
A P-Value of 0.05 implies that 5% of all tests will result in false positives. A Q-Value of 0.05 implies that 5% of significant tests will result in false positives. The second includes a lot less of false positive.
Here is an example from nonlinear.com:
Let us imagine an experiment with 3516 biochemical compound. If we take a compound which has a p-value of 0.0101 and a q-value of 0.0172.
Recall that a p-value of 0.0101 implies a 1.01% chance of false positives, and so with 3516 compounds, we expect about 36 false positives, i.e. 3516 × 0.0101 = 35.51* In this experiment, there are 800 compounds with a value of 0.0101 or less, and so 36 of these will be false positives.
On the other hand, the q-value is 0.0172, which means we should expect 1.72% of all the compounds with q-value less than this to be false positives. This is a much better situation. We know that 800 compounds have a q-value of 0.0172 or less and so we should expect 800 × 0.0172 = 13.76 false positives rather than the predicted 36.
Always consider Q-Values or Adjusted P-Values rather than (raw) P-Values.
See:
- Storey, J. D., & Tibshirani, R. (2003). Statistical significance for genomewide studies. Proceedings of the National Academy of Sciences, 100(16), 9440-9445.
- Benjamini, Yoav, and Yosef Hochberg. "Controlling the false discovery rate: a practical and powerful approach to multiple testing." Journal of the Royal statistical society: series B (Methodological) 57.1 (1995): 289-300.
To answer your biological question, we use a branch of statistics called inferential statistics. In this field, we need as much information as possible. In theory, we need a number of samples equal to the number of statistical tests we run plus one. We test roughly 24.000 genes in a differential gene expression. Yes, we would need 24001 samples.
Rather than this ridiculous high number of samples, we require at least 3. Be aware that the european consortium encode stands on minimum 12 samples per conditions, so at least 24 samples. Yet, we still require at least 3.
- Below 2, the maths simply fail due to a division by zero when one condition is compared to another. Below 3, the variability in the samples is so high, that re-running the same analysis with different samples would lead to different results. You may find below a minimal experimental design:
| Sample name | Treatment |
|---|---|
| Sample 1 | Treated |
| Sample 2 | Treated |
| Sample 3 | Not treated |
| Sample 4 | Not treated |
- Blow 3, the maths fail due to a division by zero when two conditions are compared to two others. Below 4, the variability in the analysis is very high. For example:
| Sample Name | Status | Treatment |
|---|---|---|
| Sample 1 | Control | Not Treated |
| Sample 2 | Control | Not Treated |
| Sample 3 | Control | Not Treated |
| Sample 4 | Control | Treated |
| Sample 5 | Control | Treated |
| Sample 6 | Control | Treated |
| Sample 7 | Patient | Not Treated |
| Sample 8 | Patient | Not Treated |
| Sample 9 | Patient | Not Treated |
| Sample 10 | Patient | Treated |
| Sample 11 | Patient | Treated |
| Sample 12 | Patient | Treated |
The statistical power is by far more driven by the number of samples rather than the deepness of the sequencing. Increase the number of samples, do not ask for more than 25 milions of reads and your results will be better.
Regularized logarithm (rlog), and Variance Stabilized Transformation (vst) are normalizations. Transcripts Per Milions (TPM) also is a normalization method. DESeq2, the tool designed to perform differential gene expression analyses uses either rlog or VST. While TPM could suits DESeq2 requirements, we stand in the border of DESeq2 publications and best practice.
Both rlog and VST have similar properties. However, with a very large number of samples (more than a hudread), rlog might be too slow. In an experiment in which one is interested in low counts, then rlog should be preferred as it offers more power to further shrinking methods.
See:
- DESeq2 documentation
- Love, Michael I., Wolfgang Huber, and Simon Anders. "Moderated estimation of fold change and dispersion for RNA-seq data with DESeq2." Genome biology 15.12 (2014): 550.
- Dillies, Marie-Agnès, et al. "A comprehensive evaluation of normalization methods for Illumina high-throughput RNA sequencing data analysis." Briefings in bioinformatics 14.6 (2013): 671-683.
I see a higher expression in one condition compared to another. Why is my adjusted p-value above the alpha threshold?
The adjusted p-value (or any other p-value) answers a very precise question. In the differential gene expression analysis you question is alike: "What are the genes diferentially expressed when I add the treatment X?" Note that your question was not "What are the genes differentially expressed?" The last part of your questions makes the difference.
If we only were looking for expression variations, then we could skip the statistical tests and return a simple fold change as a ratio. No need of any science back there.
The point is, we are looking for variations related to your experimental design. That's what the p-value points. The relation between the variation one sees, and the experimental design submitted.
Let us consider the following genes:
| Gene | Fold Change | Adjusted P-Value |
|---|---|---|
| Gene1 | 5 | 0.003 |
| Gene2 | 3 | 0.44 |
| Gene3 | 1.00001 | 0.0001 |
| Gene4 | -10 | 0.3 |
The Gene1 seems to be more expressed, and we can say that it is related to the hypothesis below an alpha risk of 5% (0.3%). The Gene2 seems to be more expressed, however, belo an alpha risk of 5%, this variation seems to be not related to the hypothesis, rather hazard. The expression of Gene3 seems to be almost not changing. However, this very small change is under the confidence interval (0.01%), it is significant. The last gene has a very high fold change, and the gene seems to be powerfully repressed. However, there is 30% of risk that this is not related to our experimental design, but due to hazard.
An increase of the number of samples is directly linked with the number of differentially expressed genes.
1.Liu, Yuwen, Jie Zhou, and Kevin P. White. "RNA-seq differential expression studies: more sequence or more replication?." Bioinformatics 30.3 (2014): 301-304.
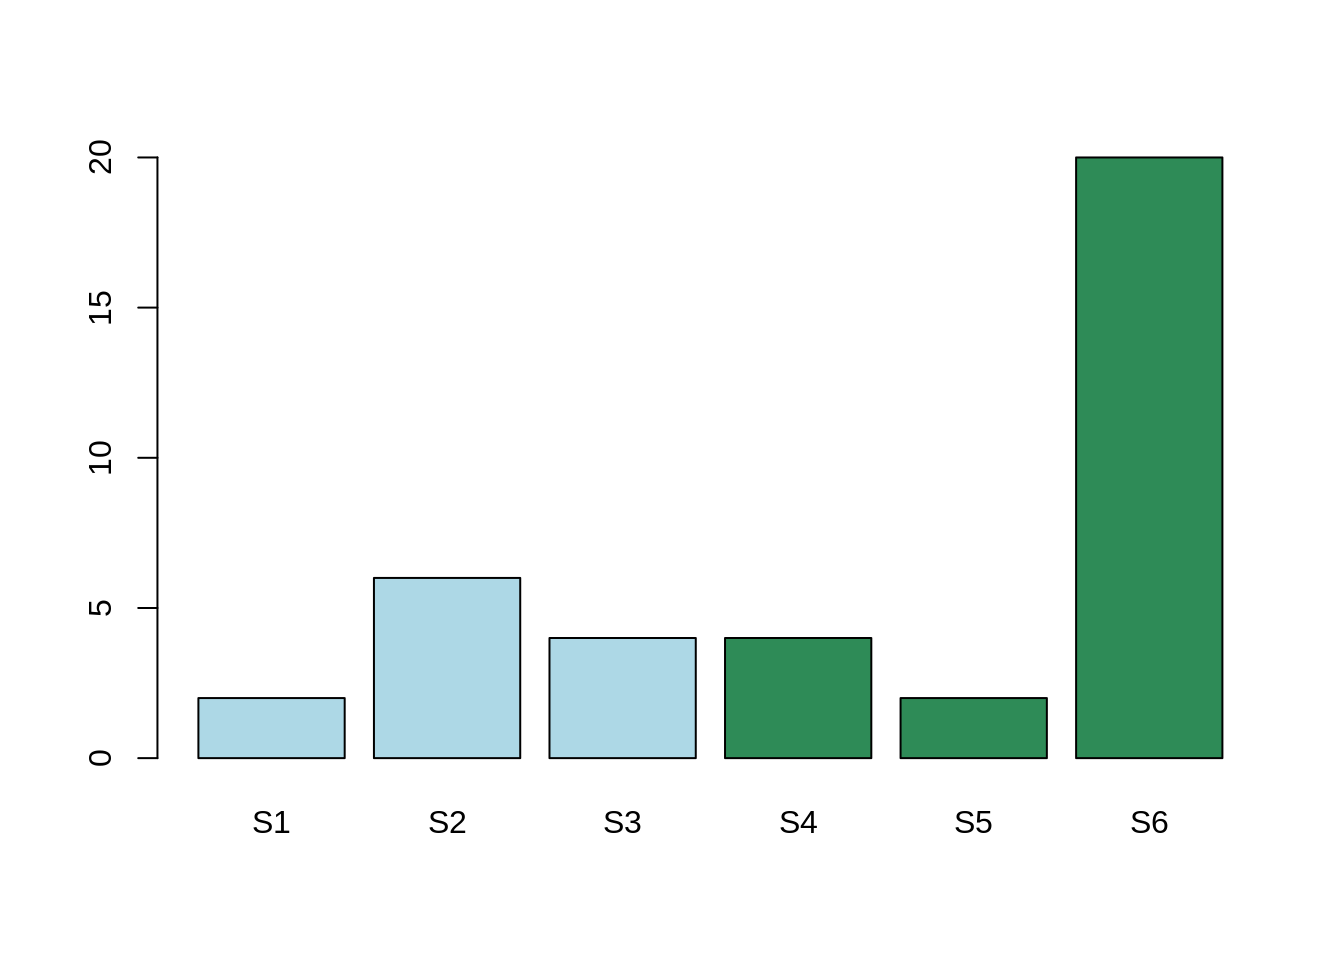
Here, the mean expression for the gene Gene1 for condition A is: 4. The mean expression for the gene Gene2 for condition B is: 8.6.
The mean expression in the two conditions are different, however, this difference is due to one single sample which is not behaving like the others.
In conclusion, there is indeed a variation. This variation is due to one sample, rather than one condition. In that case, the adjusted P-Value will be high and considered as non-significant. We are not interested in the variability on one sample. We are interested in the variability of one global condition.
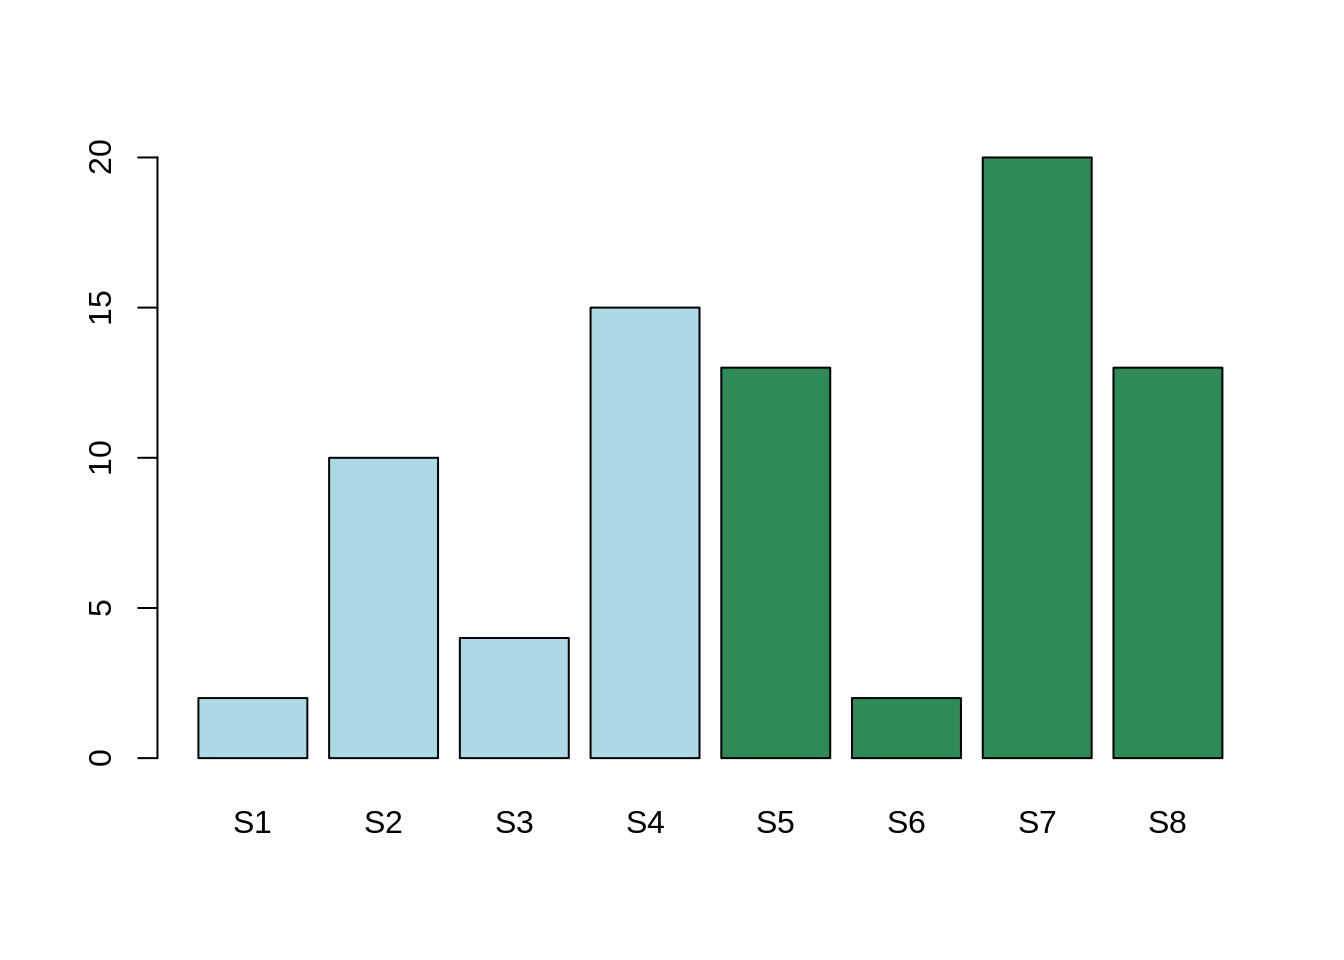
Here, the mean expression for the gene Gene1 for condition A is: 4. The mean expression for the gene Gene2 for condition B is: 8.6.
The mean expression in the two conditions are different, however, this difference is less than the expression variability within both Condition A and Condition B.
The differential expression is more likely to be between samples 1, 3, and 6 in one hand, and 2, 4, 5, 7 and 8 in the other hand.
In conclusion, there is indeed a variation. This variation seems not related to our hypothesis, rather than an unknown factor. This unknown factor is called "confounding factor". In this case, the adjusted P-Value will be high and, therefore, non significant.
What should I consider a full model rather than a comparison of a subset of my samples? What is Simpson's paradox?
In this case, we have nested conditions. Let's imagine a tumor, which can be treated by either chemotherapy or surgery. We want to know which one perform better. For the last 1000 treated patients, you will find below the success rate of each of these methods:
| Treatment | Nb. recoveries | Nb. failures | Recovery rate |
|---|---|---|---|
| Chemotherapy | 761 | 239 | 76% |
| Surgery | 658 | 342 | 66% |
It seems clear that the chemotherapy performs better than surgery.
However, if you consider the tumor size, the numbers are the following:
| Treatment | Tumor size | Nb. recoveries | Nb. failures | Recovery rate |
|---|---|---|---|---|
| Chemotherapy | > 2cm (large) | 90 | 92 | 49% |
| Chemotherapy | < 2cm (small) | 564 | 331 | 63% |
| Surgery | > 2cm (large) | 94 | 11 | 90% |
| Surgery | < 2cm (small) | 671 | 147 | 82% |
Now, considering the tumor size, the surgery always perform better! You can check the numbers, both table talk about the very same numbers!
Taking the number in one table or the other changes the conclusion, how to decide ?! How can chemotherapy perform better while, taking into account the tumor size, surgery outperforms ? This is called the Simpson paradox.
There are two possible observations here:
- Smaller tumors have a higher recovery rate, which is not surprising.
- On large tumors, surgery is used more often than chemotherapy.
So, surgery performs better, however, it is used more often on difficult cases.
Here, "Treatment" is our factor of interest. "Tumor size" is a confounding factor. Surgery is used on larger tumors. The tumor size acts on both, cause and consequence in our analysis.
Conclusion:
If your bioinformatician chose to keep a given additional factor in your analysis, there is a reason. If a gene of interest appears while and only while this additional factor is (is is not) taken into account, you cannot chose the differential analysis you prefer in order to satisfy your initial hypothesis. You could fall under this kind of statistical traps. Your bioinformatician is here to help you!