| layout | title | permalink |
|---|---|---|
none |
The example of a malformed rss item |
/rss/ |
<atom:link href="https://svgol.github.io/rss" rel="self" type="application/rss+xml"/> <title>svgol' test feed</title> https://https://svgol.github.io/rss Stories and tutorials on the latest technologies in cloud application development. en Thu, 20 Jan 2022 07:00:00 +0000 sy:updatePeriodhourly</sy:updatePeriod> sy:updateFrequency1</sy:updateFrequency> <title>How to connect Prometheus to OpenShift Streams for Apache Kafka</title> https://developers.redhat.com/articles/2021/12/17/how-connect-prometheus-openshift-streams-apache-kafka
You've always been able to view some metrics for Red Hat OpenShift Streams for Apache Kafka in the UI or access them via the API. We recently added a feature to OpenShift Streams for Apache Kafka that exports these metrics to Prometheus, a system monitoring and alerting toolkit. Connecting these services lets you view your exported metrics alongside your other Kafka cluster metrics.
This article shows you how to set up OpenShift Streams for Apache Kafka to export metrics to Prometheus. The example configuration includes integration with Grafana, a data visualization application that is often used with Prometheus. Almost all observability products and services support Prometheus, so you can easily adapt what you learn in this article to your observability stack.
We will use a number of guides for this configuration; You can open them now or use the links in each section:
- OpenShift Dedicated: Creating a cluster
- Configuring a GitHub identity provider
- OpenShift Dedicated: Managing administration roles and users
- Getting started with Red Hat OpenShift Streams for Apache Kafka
We will also use these examples from the Prometheus and Grafana projects, respectively:
To begin, you need to set up a Kubernetes cluster to run Prometheus and Grafana. The example in this article will use Red Hat OpenShift Dedicated.
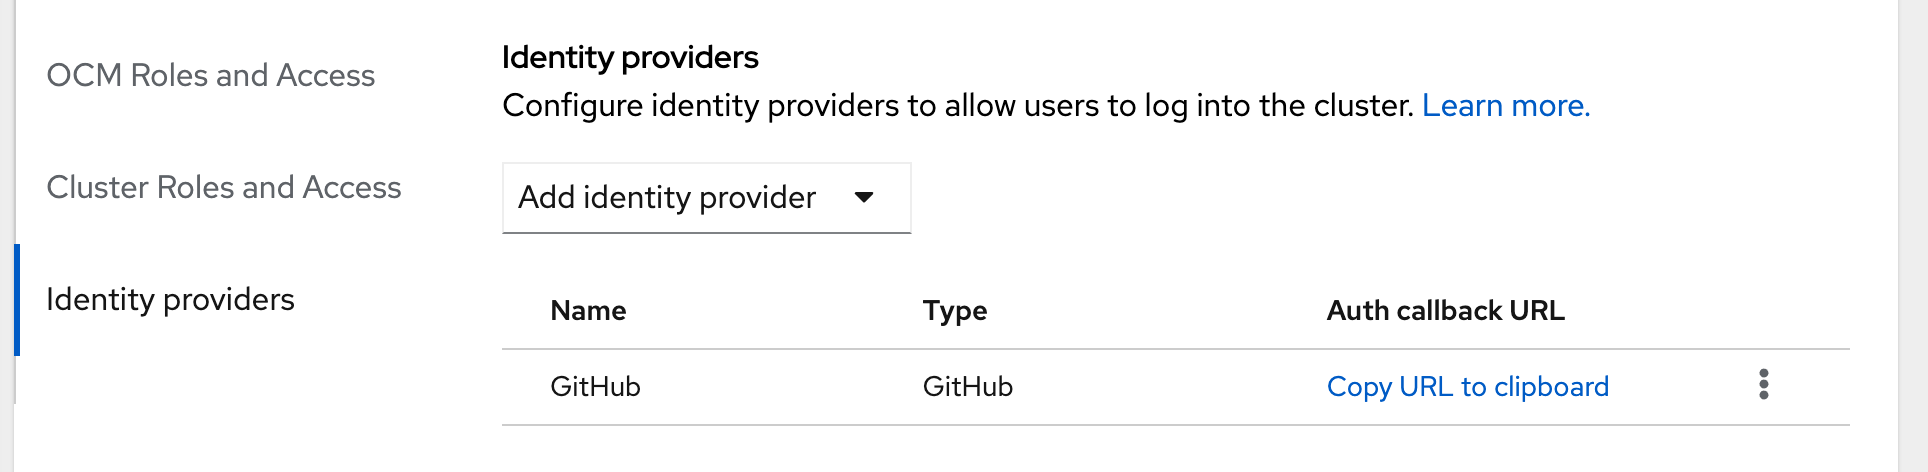
Start by following the OpenShift Dedicated guide to creating a Customer Cloud Subscription cluster on Amazon Web Services. Then, follow the instruction to configure a GitHub identity provider so that you can use your GitHub ID to log in to Red Hat OpenShift. (Other options are available, but we're using these methods for the example.) Once you've got things configured, your OpenShift Cluster Manager should look like the screenshot in Figure 1.
      </div>
<div class="field field--name-field-caption field--type-string field--label-hidden field__items">
            <div class="rhd-c-caption field__item">
    Figure 1. Configure GitHub as an identity provider for logging in to the OpenShift Dedicated console.
        </div>
      </div>

  </article></div>
Finally, give your GitHub user the cluster-admin role by following the OpenShift Dedicated guide to managing administration roles and users. Note that the Prometheus examples assume you have admin permissions on the cluster. You'll need to use your GitHub username as the principal here.
Now, you can log in to the console using the Open Console button.
You can install Prometheus on OpenShift Dedicated via the OperatorHub. Just navigate to Operators -> OperatorHub, filter for Prometheus, click Install, and accept the defaults. You can validate that it's installed in the Installed Operators list. Once that's done, do the same for Grafana.
Note: You might have command-line muscle memory and prefer to use kubectl with a Kubernetes cluster. If you want to take this route, switch to a terminal and copy the login command from the OpenShift console user menu to set up your Kubernetes context.
To get Prometheus working with OpenShift Streams for Apache Kafka, use the examples in the Prometheus documentation to create an additional scrape config. You will need to make a couple of modifications to your configuration.
First, create the additional config file for Prometheus. To do this, create a file called prometheus-additional.yaml with the following content:
- job_name: "kafka-federate"
  static_configs:
  - targets: ["api.openshift.com"]
  scheme: "https"
  metrics_path: "/api/kafkas_mgmt/v1/kafkas//metrics/federate"
  oauth2:
    client_id: ""
    client_secret: "Your Service Account Client Secret"
    token_url: "https://identity.api.openshift.com/auth/realms/rhoas/protocol/openid-connect/token
The angle brackets (<>) in the listing indicate details you'll need to gather from your own OpenShift Streams for Apache Kafka environment:
- You can see your Kafka ID by clicking on your Kafka Instance in the OpenShift Streams for Apache Kafka console.
- Follow OpenShift Streams for Apache Kafka getting started guide to create a Kafka instance and service account for each instance. As described in the guide, copy and paste the client ID and client secret into
prometheus-additional.yaml.
Now, you need to create a Kubernetes secret that contains this config file:
kubectl create secret generic additional-scrape-configs --from-file=prometheus-additional.yaml --dry-run -o yaml | kubectl apply -f - -n Finally, apply prometheus.yaml, prometheus-cluster-role-binding.yaml, prometheus-cluster-role.yaml, and prometheus-service-account.yaml using kubectl apply -f .
To get Grafana working, use the GrafanaWithIngressHost.yaml example code from the Grafana project's GitHub repository. Remove the hostname field from the file, as OpenShift Dedicated will assign the hostname automatically.
Now, find the URL for Grafana from the OpenShift console Routes section, and open Grafana. The login details for Grafana are in the Grafana custom resource.
Next, connect Grafana to Prometheus by navigating to Settings -> Data Sources. Click Add data source, then click Prometheus. At that point, all you need to do is enter http://prometheus-operated:9090, the URL of the service, then click Save & Test.
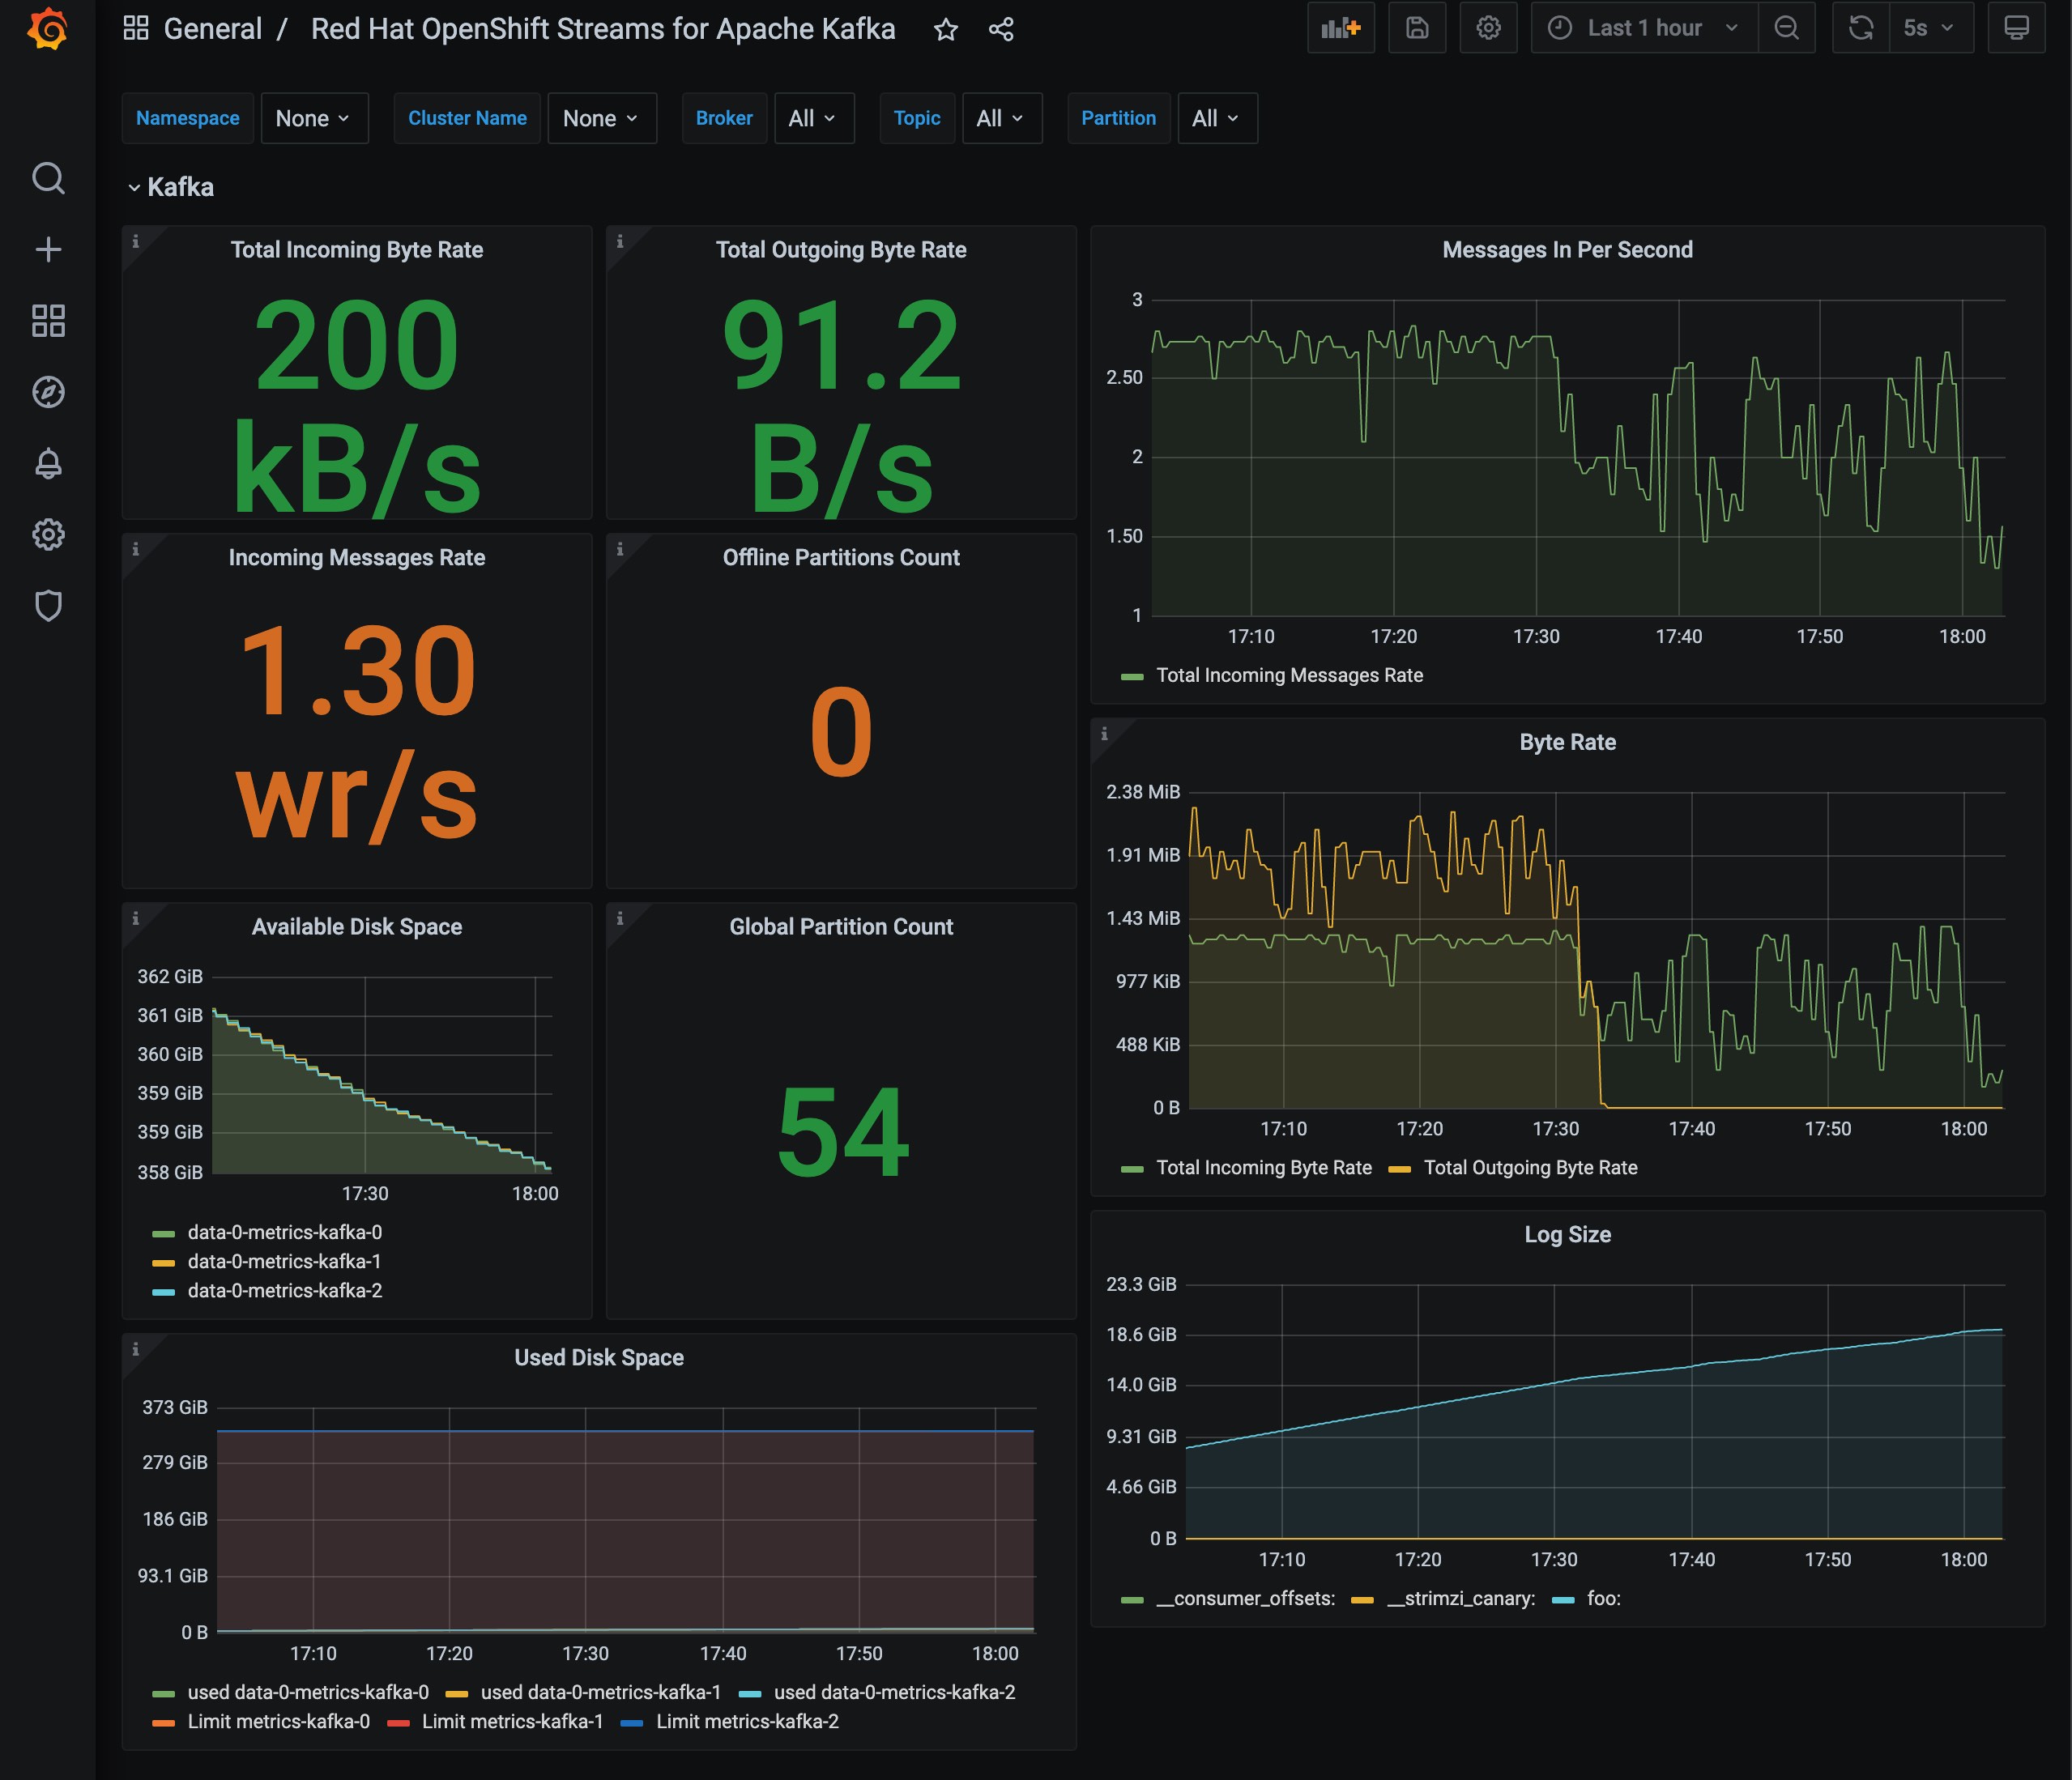
You should now find metrics for your Kafka cluster in Grafana. Figure 2 shows a Grafana dashboard that displays most of the metrics available with OpenShift Streams for Apache Kafka.
      </div>
<div class="field field--name-field-caption field--type-string field--label-hidden field__items">
            <div class="rhd-c-caption field__item">
    Figure 2. A sample Grafana dashboard for OpenShift Streams for Apache Kafka.
        </div>
      </div>

  </article></div>
The JSON that defines this dashboard is available on GitHub.
In this article, I've shown you how to use Prometheus and Grafana to observe an OpenShift Streams for Apache Kafka instance. Prometheus is a very widely adopted format for monitoring and can be used with almost all observability services and products.
The post How to connect Prometheus to OpenShift Streams for Apache Kafka appeared first on Red Hat Developer.Thu, 13 Jan 2022 07:00:00 +0000 Bob Reselman 19d5abe2-3efb-49c1-91ad-8752f9686426