Skip to content
New issue

Have a question about this project? Sign up for a free GitHub account to open an issue and contact its maintainers and the community.

By clicking “Sign up for GitHub”, you agree to our terms of service and privacy statement. We’ll occasionally send you account related emails.

Already on GitHub? Sign in to your account

Expansion Plan #1

Open
9 of 12 tasks
nocollier opened this issue Sep 27, 2024 · 4 comments
Open
9 of 12 tasks

Expansion Plan #1

nocollier opened this issue Sep 27, 2024 · 4 comments
Assignees

Comments

@nocollier
Copy link
Contributor

nocollier commented Sep 27, 2024

The following are notes and action items from meetings between Nate and Elias.

To Do

Nate

  • Change Koppen regions to just first letter commit
  • Rerun convert.py on Wang products to get uncertainty
  • Commit OLCF setup to a repo (this one).
  • Re-run model setup with corrected evspsbl and model selection
  • Rerun ilamb2.7.2 with 4 Koppen regions and changes made 9/26
  • Grab ESACCI and encode it, add to comparison
  • Implement flexible volumetric fraction to mass area density conversions, always match the reference data
  • Expand the layering logic in the configure files to allow for depth ranges across which we will integrate
  • Decide which depth ranges would be good to run in the SM analysis

Elias

  • What can we find out about this visible depth of the ESACCI product? Is there a map?
  • Move E3SMv3 mrsol, mrsos, evspsbl, gpp, lai to OLCF and let Nate know where they are
  • Slides explaining the volumetric fraction vs mass area density (see math below)

What is currently done

  • ILAMB 2.7 analysis
    • With ~30 models comparing Wang EC/OLC at 0 and 0.5 [m]
    • With reduced set of models where you also look at relationships with gpp, lai, and evspsbl
    • What concerns do you have?
    • What have we learned?
      • Models are all over the place, large biases and variability
      • CESM2 has an issue/feature with hilat soil moisture, also seen in the mrsol/gpp relationships.

Research questions

  • Is the large bias and variability persisted in other reference products?
  • How does the reference data uncertainty affect our conclusions about large model spread?
  • Is the model spread pervasive globally or are there issues with a single region?
  • Does CESM2 mrsol relationships with gpp hold globally vs hilat?

Down the road

  • Also get SMAP
  • Annual cycle analysis in ilamb3 with uncertainty (ilamb3 can be for developing new benchmarking ideas)
  • Set Elias up with ilamb3 on NERSC
@nocollier
Copy link
Contributor Author

nocollier commented Oct 2, 2024

A few things we have learned while doing this:

  • The ESACCI mrsos product is surface only and according to the documentation, the visible soil depth varies between 2 - 5 [cm]. This makes conversion from volumetric fraction to water mass ambiguous. It also makes the comparison to models, where mrsos is defined as the mass of water in the top 10 [cm], ambiguous.
  • We need to implement a volumetric fraction <--> mass area density conversion and always change the models, where soil layers are always given, to match the units of the reference data.
  • Because the layering of models is so different, and because the soil moisture is the total content in each layer, ILAMB's picking of the layer closest to the depth provided in the configure file is not a good functionality. (It is fine for something with, say, volumetric density units). We need to implement something that will work on depth ranges.
  • What should those ranges be? 0-10cm to compare to mrsos, what others?

@nocollier
Copy link
Contributor Author

Some observations/issues with the ESACCI mrsos product. See the ILAMB results:

  • As mentioned above, the soil depth of the ESACCI product is 2-5 [cm] and mrsos is a consistent 10[cm] everywhere. You would expect the models to be consistently high biased globally which they are. We could consider adding a scale_factor=0.35 ( (2+5)/2 / 10 ) to the model data to try to correct for this. It would rather need to be the reciprocal and applied to the ESACCI data.
  • There are some weird dips in the product around 1985-1990. Is this real? Did we make an error in encoding? Is it because of a transition in data sources around those date ranges?
  • The annual cycle of our encoded product appears to be exactly the opposite of what models predict. Is that a bug or a feature?

@nocollier
Copy link
Contributor Author

nocollier commented Oct 3, 2024

After more discussion we have come down to the following plan @EliasMassoud1

  1. Model soil moisture results (mrsos and mrsol) will always be converted to a volumetric fraction. For the case of mrsos we will use an implicit cell height of 0.1 [m].
  2. For any soil moisture comparison, the configure file will specify a depth range of the form depth_range = 0,0.05. This means that no matter what reference data or model is used, the comparison will work on the mean volumetric fraction between those two soil horizons.
  3. The flexibility in mrsol vs mrsos will allow us to treat both in the same framework.
  4. We have elected to present 2 soil moisture comparisons.
    • The near surface soil moisture. Roughly the first few [cm], but definitions will vary because the reference products also vary. The Wang dataset has the first horizon at 10 [cm], but the ESACCI product varies implicitly between 2-5 [cm] based on satellite capability.
    • The root zone soil moisture. Roughly the first 1 [m].

@nocollier
Copy link
Contributor Author

nocollier commented Oct 7, 2024

Observations

On Units and Conversions

You will find many observational products have units of m3 m-3 (volumetric fraction) while the CMIP models will have soil moisture expressed in units of kg m-2 (mass area density). These are convertible using the following logic. If we express the volume of the cell as the area times the change in depth:

$$V_{\mathrm{cell}} = A_{\mathrm{cell}} \cdot \Delta z$$

Then we can express the volumetric fraction as:

$$\phi = \frac{V_{\mathrm{water}}}{V_{\mathrm{cell}}}$$

We can also relate the volume of water to its mass by:

$$M_{\mathrm{water}} = V_{\mathrm{water}} \rho$$

The models are reporting a mass area density. So if we want to relate this to the volumetric fraction:

$$\begin{align*} \frac{M_{\mathrm{water}}}{A_{\mathrm{cell}}} &= \frac{V_{\mathrm{water}} \rho}{A_{\mathrm{cell}}}\\\ &= \frac{\phi V_{\mathrm{cell}} \rho}{A_{\mathrm{cell}}}\\\ &= \frac{\phi A_{\mathrm{cell}} \Delta z\ \rho}{A_{\mathrm{cell}}}\\\ &= \phi \Delta z\ \rho \end{align*}$$

However while these 2 quantities can be converted, they are different. The volumetric fraction is pointwise valid anywhere in the cell and thus can be evaluated at discrete depths. But when we multiply by $\Delta z$ to convert to the mass area density, it makes the resulting quantity an integral (or sum) of moisture. To make a fair comparison you must integrate across the same depth range.

For this reason, we have decided to always change the model quantities to volumetric fractions as the depth bounds are always available and it is the most general quantity. This goes better with the reference data where soil horizons vary. This has changed some conclusions. The spread of models is not quite as large. We were comparing integrals over different ranges before.

mrsos vs mrsol

There is a difference in how models represent the top 10 [cm] of soil moisture in mrsol vs mrsos. Note that while IPSL has a mrsol, their depths are just integer indices and fail in the ILAMB analysis.

Difference in Global Mean mrsos vs mrsol to 10cm [%]
                     Data
Model                    
ACCESS-ESM1-5   23.357065
BCC-ESM1        10.360161
CESM2           -7.376346
SAM0-UNICON      5.958003
GFDL-ESM4       -5.664371
GISS-E3-G        5.530903
NorESM2-LM      -4.140469
AWI-ESM-1-1-LR  -1.231053
MPI-ESM1-2-LR   -1.188081
CanESM5-1        0.000000
CNRM-ESM2-1      0.000000
CMCC-ESM2        0.000000
EC-Earth3-CC     0.000000
MRI-ESM2-0       0.000000
TaiESM1          0.000000
UKESM1-0-LL      0.000000
IPSL-CM6A-LR          NaN

Regions

We have run the ILAMB analysis over a new (to us) set of regions consisting of the top level Koppen climate regions: Tropical, Desert/Semi-Arid, Temperate, and Cold. We also added a definition of "global" to be just the land areas not counting Antarctica. Use the pulldowns on the ILAMB runs to see regional results.

Open Questions

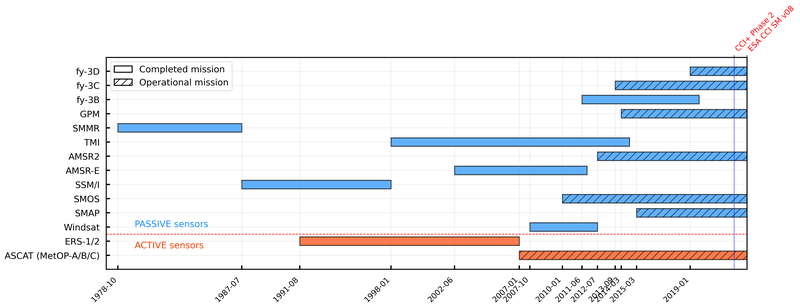
  1. For ESACCI, we observe a strange dip in the globally integrated mean. We think this may be due to the overlap of satellites as seen in the figure below. Should we consider only using part of this record?

  1. The ESACCI product also represents the near surface soil moisture, but that definition is loosely defined. The documentation states that the satellites "see" down to 2-5 [cm]. We have temporarily included both ends of the spectrum to see how they compare to models. Which should we use?
  2. There isn't a strong annual cycle to soil moisture and the ESSCCI product even displays a large period shift. Perhaps the annual cycle is not a good quantity to look at?
  3. The wide model spread from before I believe was due to comparing mass area fluxes that had been integrated to different depths. For example, now I see the mean moisture state to range between 0.17 to 0.304 globally. This seems pretty reasonable to me?

Sign up for free to join this conversation on GitHub. Already have an account? Sign in to comment
Labels
None yet
Projects
None yet
Development

No branches or pull requests

2 participants