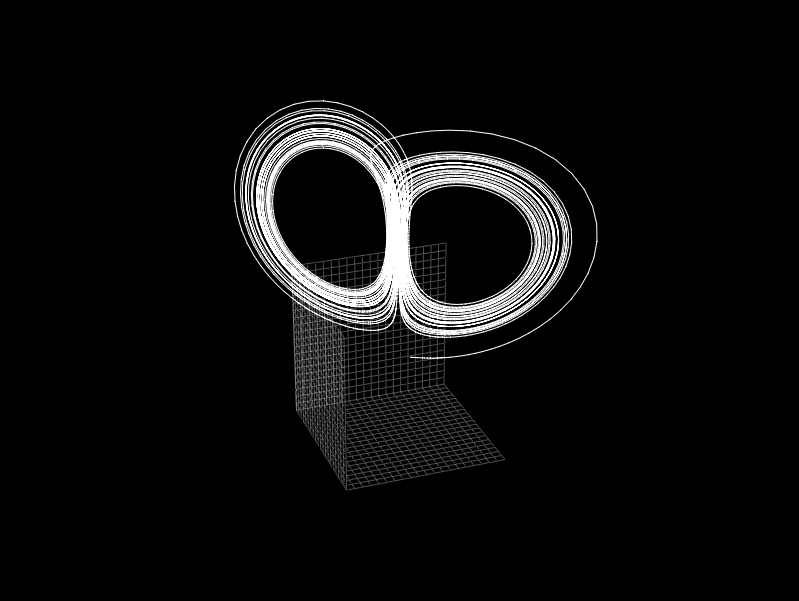
A simple animated Lorentz system plot for python using matplotlib or PyQtGraph. Using Euler forward method (from wikipedia).
| Matplotlib | PyQtGraph |
|---|---|
 |
 |
Required libraries :
- numpy v1.12.1+
- matplotlib v2.0.0+
- PyQtGraph v0.10.0+ (optional)
- python-opengl (optional, but necessary if PyQtGraph is selected)
Clone the repository,
git clone https://github.com/raymas/Lorentz.git
install dependencies (matplotlib only) :
pip install matplotlib numpy
PyQtGraph from http://pyqtgraph.org/ and :
pip install pyside PyOpenGL numpy
Please read CONTRIBUTING.md for details on our code of conduct, and the process for submitting pull requests to us.
- raymas - Initial work - raymas
See also the list of contributors who participated in this project.
This project is licensed under the GNU 3.0 License - see the LICENSE.md file for details