
[TOC]
Before we start, we need to understand some of the terms used in MicroOps.
A microservices system used for benchmarking tests is called a benchmark and is maintained in the form of Yaml files in MicroOps.
The Benchmark module is responsible for hosting benchmark microservices deployment files. It integrates user-uploaded microservices deployment scripts with relevant descriptions.
Users can manage their own benchmarks, view and download publicly available benchmarks.
A running benchmark microservices system is referred to as a testbed, providing an environment for experiments and testing.
The Testbed module is responsible for hosting user testbeds.
Users can view and manage their deployed testbeds and can also supplement them with user traffic simulation.
All operations in MicroOps revolve around Testbeds.

The Benchmark module homepage displays a list of benchmark microservices in a card format. You can filter them by selecting either public or private to view benchmarks that are publicly available or your own private benchmarks.
If you want to deploy a microservices system, you can click the DEPLOY NOW button on the corresponding benchmark card, as shown in the image below. Follow the popup instructions to enter a name for the system and click YES to proceed.

If you want to upload your own benchmark, simply click the first + card, and you will be redirected to the Add Page. Follow the requirements to fill in the information and upload the files.
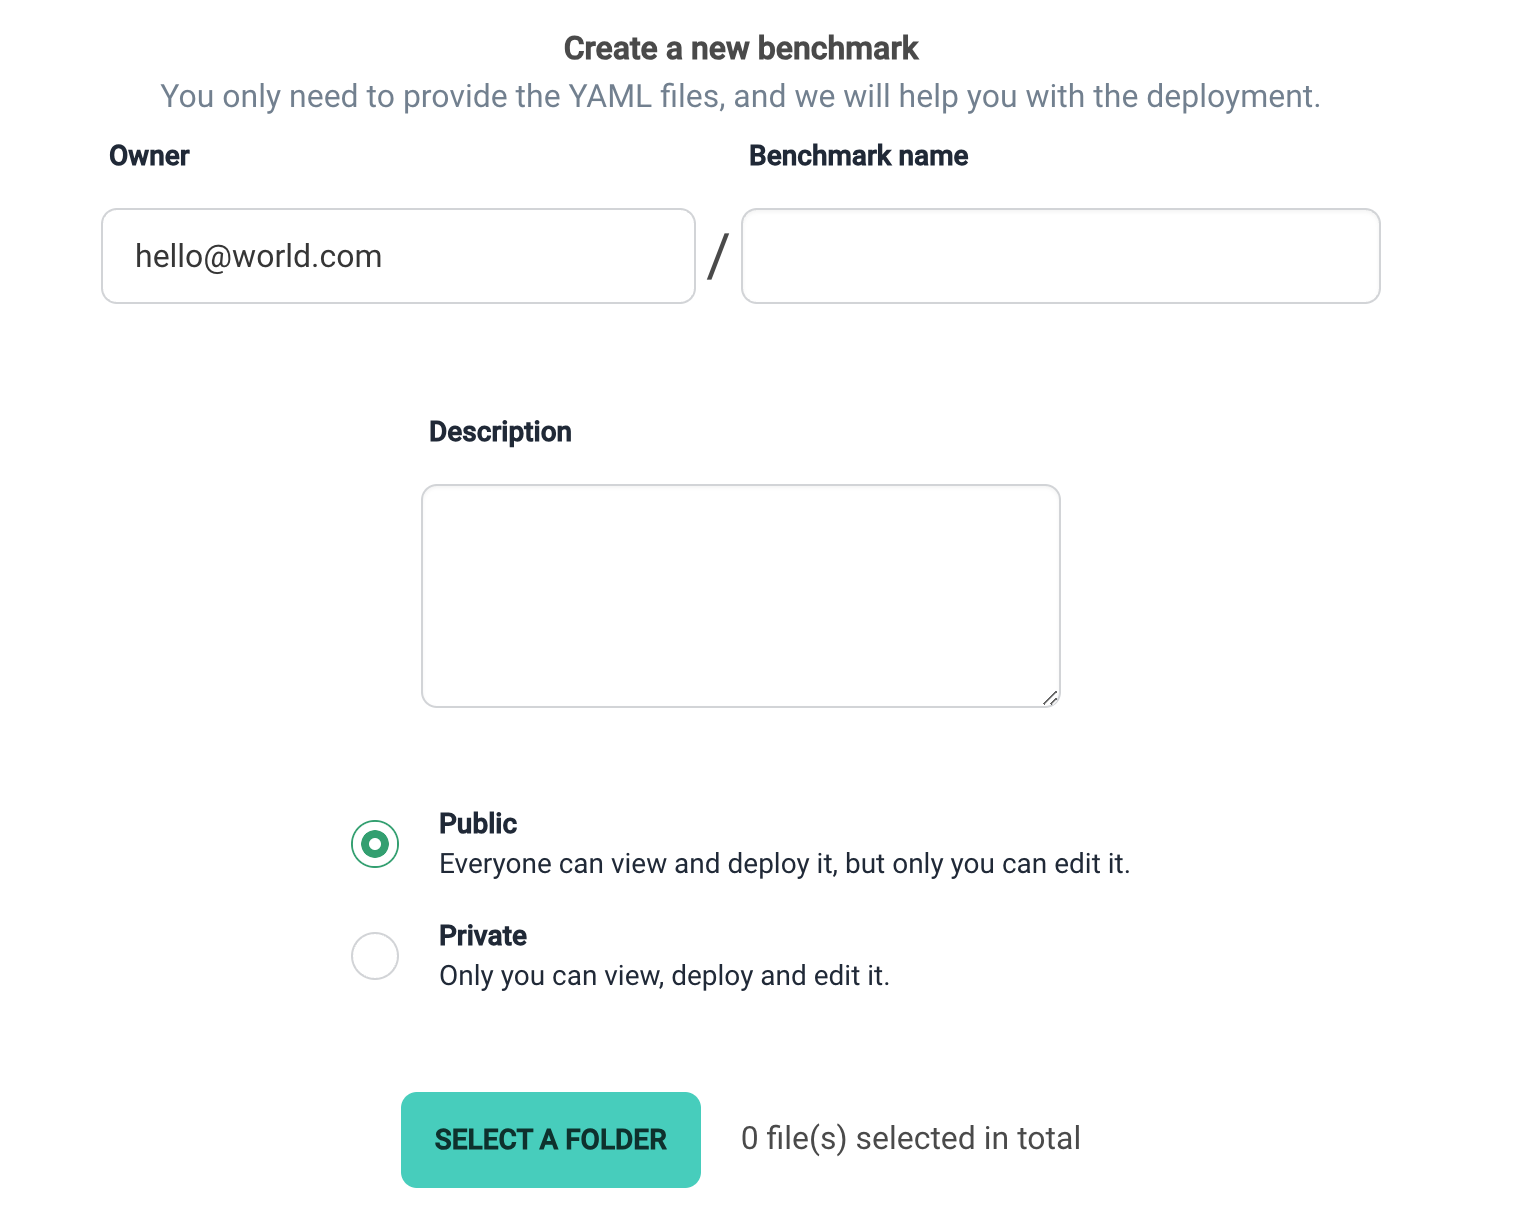
As per the instructions in the input fields, fill in the benchmark name and description (which will be displayed on the homepage card), choose benchmark visibility, and upload deployment-related files.
Note: Please carefully read the platform's requirements for file uploads and make necessary changes based on error prompts.
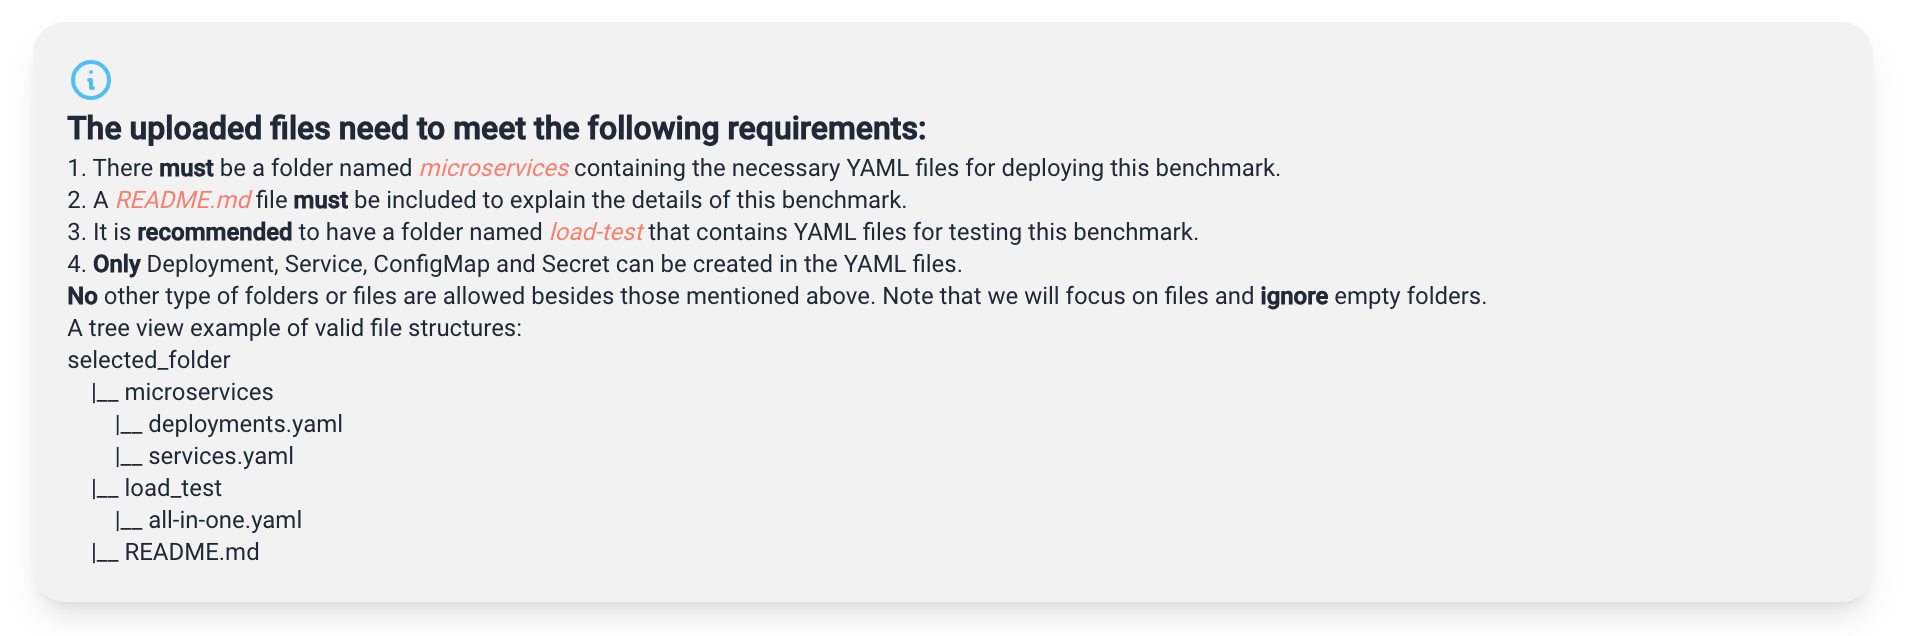
In summary, the platform allows the upload of README files and YAML files used for deployment, with YAML files limited to containing Deployment, Service, Configmap, and Secret resources.
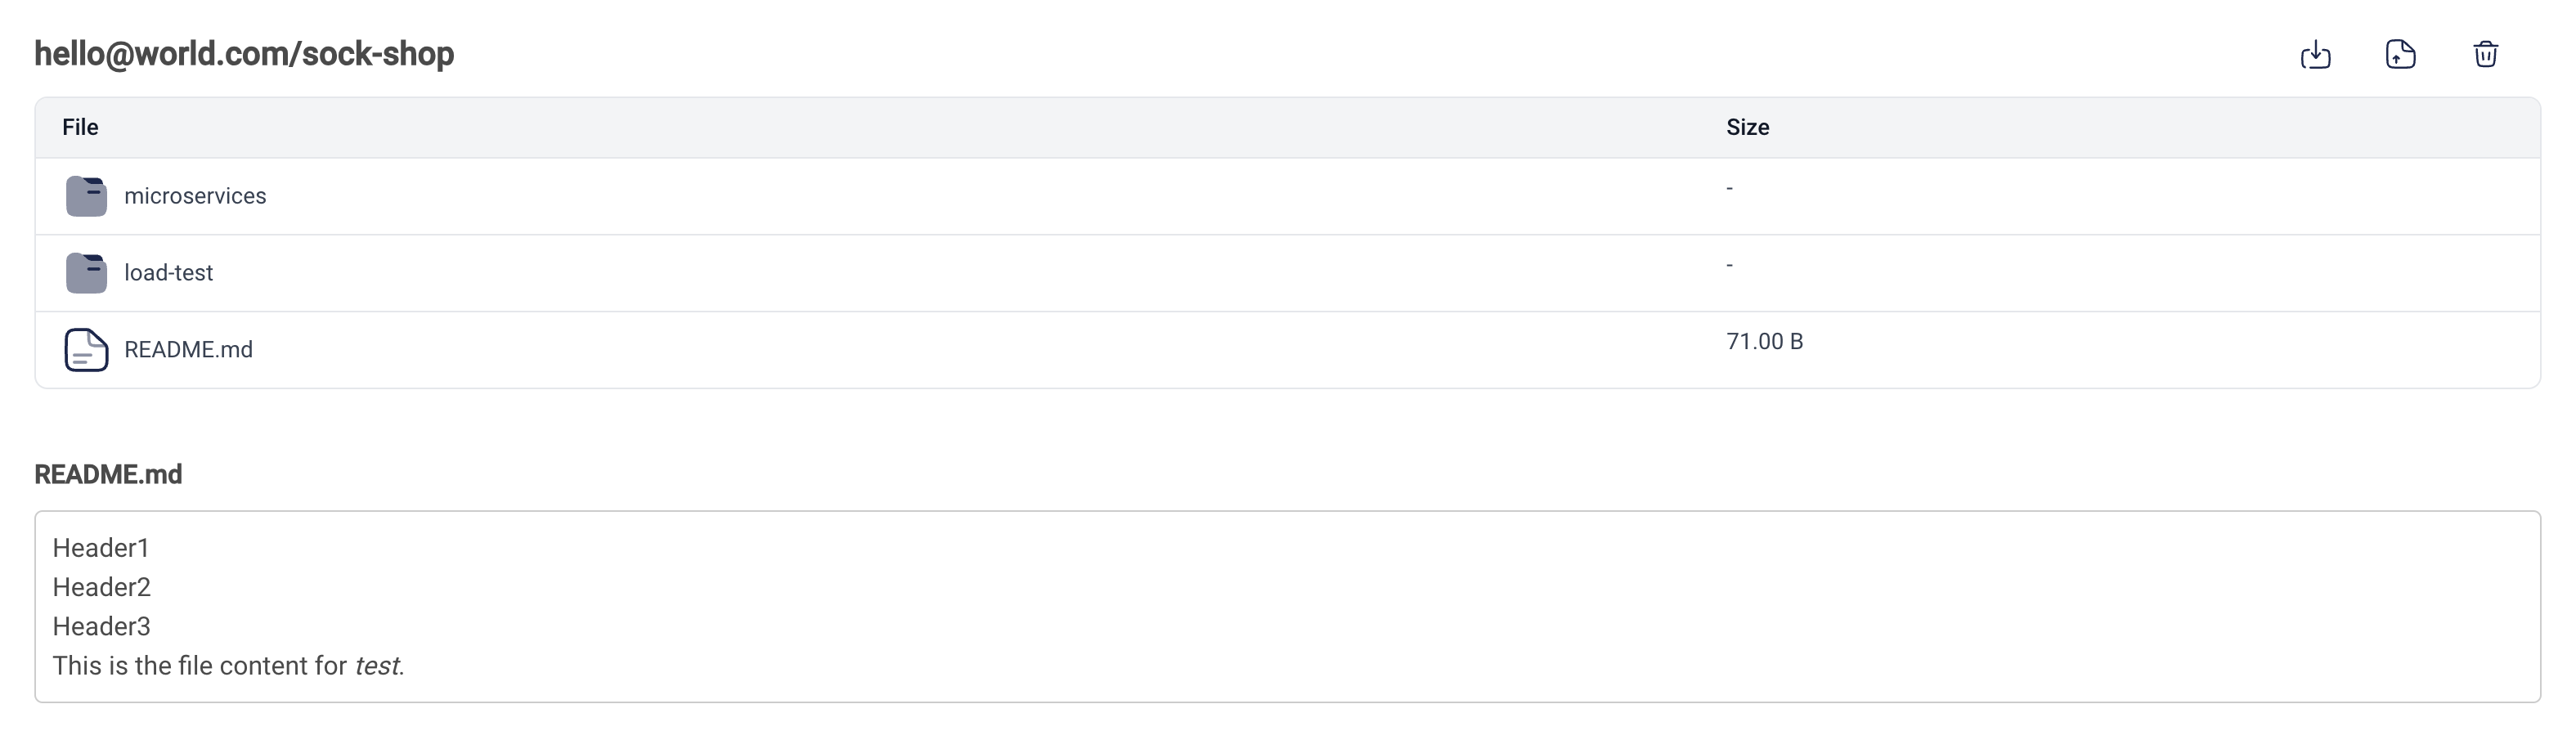
The Files page displays benchmark-related files in a format similar to Github, offering various actions in the top right corner of the page:
- If you are the owner of the benchmark, you can download, replace, and delete benchmark files.
- If you are not the owner of the benchmark, you only have permission to download.

The Testbed module homepage consists of an Add button and a table containing user-related testbed information. Clicking the Add button will take you to the Benchmark module homepage. The table has four columns, including:
- Name: The user's naming of the testbed, which is a hyperlink that can be clicked to access the details page of the testbed.
- Benchmark: The name of the microservices system used by the testbed, given in the form
email/name, whereemailis the owner of the benchmark, andnameis the benchmark's name. - Namespace: The namespace to which the testbed belongs in Kubernetes, automatically created by the platform.
- Ops: Supported user operations, including two operations:
- Traffic Simulation: If the user's benchmark file includes YAML files for traffic simulation, they can deploy or remove traffic simulation.
- Delete Testbed: Delete all resources of the testbed, including the microservices system and traffic simulation.
The details page consists of three tab subpages: Pods, Services, and Ingresses.
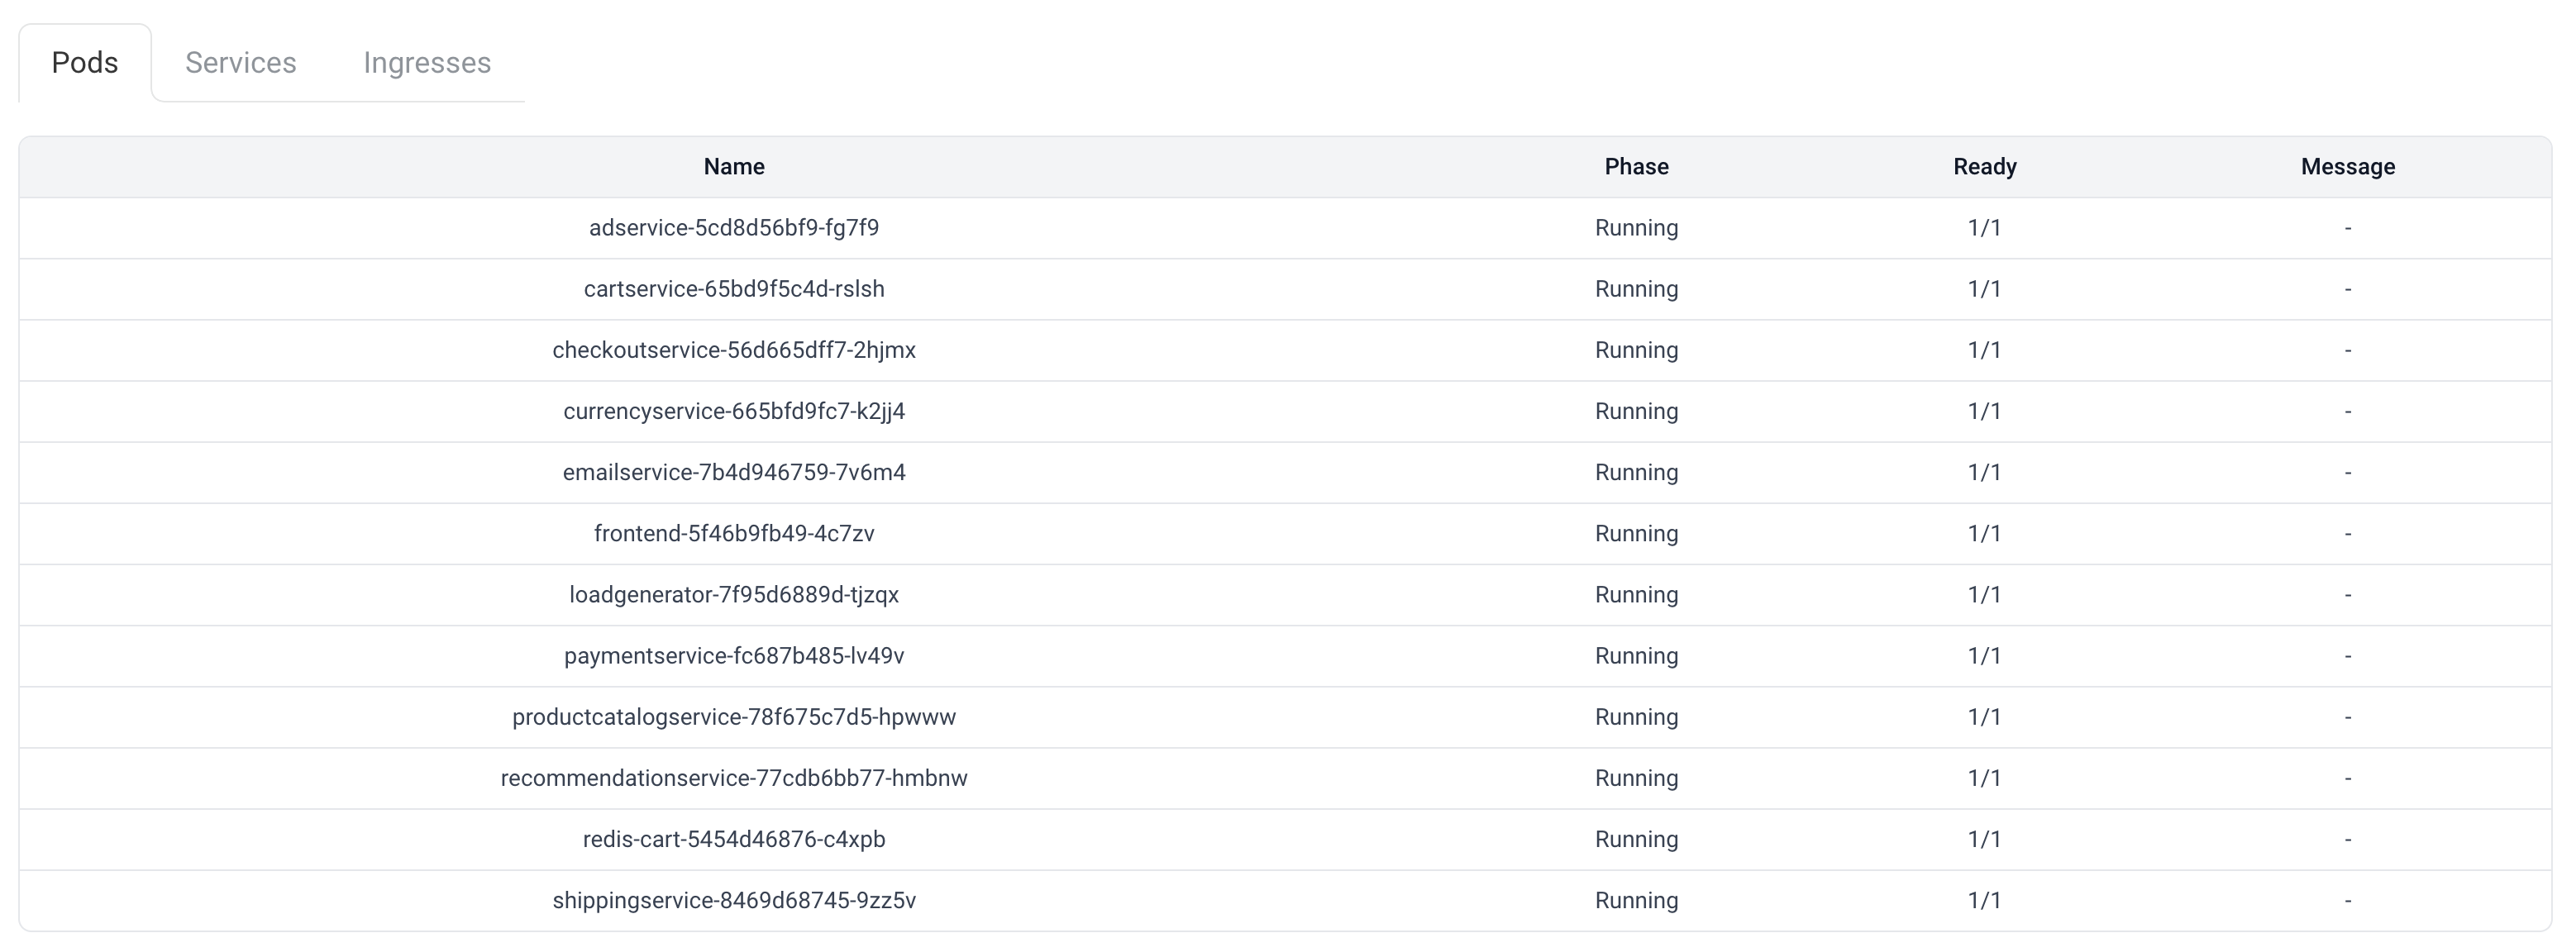
Asynchronously monitor the status of each pod in the current testbed every second. The table has four columns, including:
- Name: Pod name generated by Kubernetes.
- Phase: The phase of the pod, i.e., its position in the lifecycle.
- Ready: Whether the pod is ready.
- Message: Human-readable messages providing detailed information about the pod's state transitions.

Get information about the services created in the testbed, which is essentially the content specified in the YAML files uploaded by the user. The table has four columns, including:
- Name: The name of the service specified by the user in the benchmark's YAML file.
- Namespace: The namespace where the service is located, which is the same as the testbed's namespace.
- Labels: Labels added to the service by the user in the YAML file.
- Ports: Ports exposed by the service.
- Type: The type of the service, determining how the service is exposed in the network.

It includes an Add button and a table of ingresses you have added.
Click the Add button to select the service and corresponding port you want to add an ingress to. The platform will create an ingress and provide an access URL. You can use this URL to access the corresponding service. This is typically used to access the frontend of microservices or traffic simulation.

The homepage of the Chaos module consists of three tab subpages that display lists of fault experiments, including:
- Experiments: Displays the history of
individual fault experiments. - Schedules: Displays the history of
scheduled fault experiments. - Archives: Displays archived Experiments and Schedules.
For detailed information on experiment types and configurations, please refer to the Injection section of the documentation.
Note: This module only allows users to inject service faults in Kubernetes and does not support injecting faults into underlying physical machines, as this could threaten the resources and security of other users.
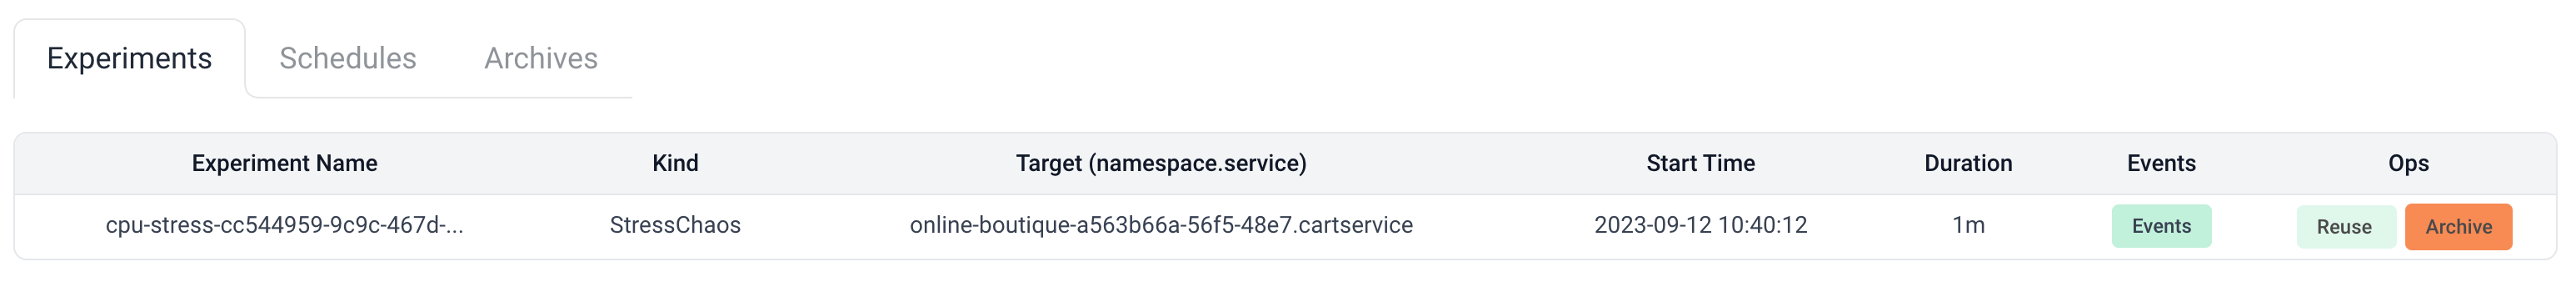
The Experiments table has seven columns, including:
- Experiment Name: The name of the experiment, automatically generated by the platform in the format of
type-uid, wheretypeis the type of fault injection, anduidis a unique identifier generated using UUID. - Kind: The category of the fault injection, where one category (kind) can contain multiple types (type), corresponding to the
Kindfield value in Chaos Mesh's fault YAML files. - Target: The target of the fault injection, with the format displayed as
namespace.service. The platform only allows service fault injection in Kubernetes. - Start Time: The start time of the fault injection.
- Duration: The duration of the fault injection.
- Events: By clicking the Events button, you can retrieve the most recent events of the fault experiment to understand its status (achieved through asynchronous monitoring with 'watch').
- Ops: Supported user operations, including:
- Reuse: By clicking the Reuse button, you can view the YAML file corresponding to the fault experiment and click YES to reuse the experiment (the platform will automatically change the experiment name).
- Archive: Pauses and archives the experiment. Archived experiments will not appear in the table of historical records.
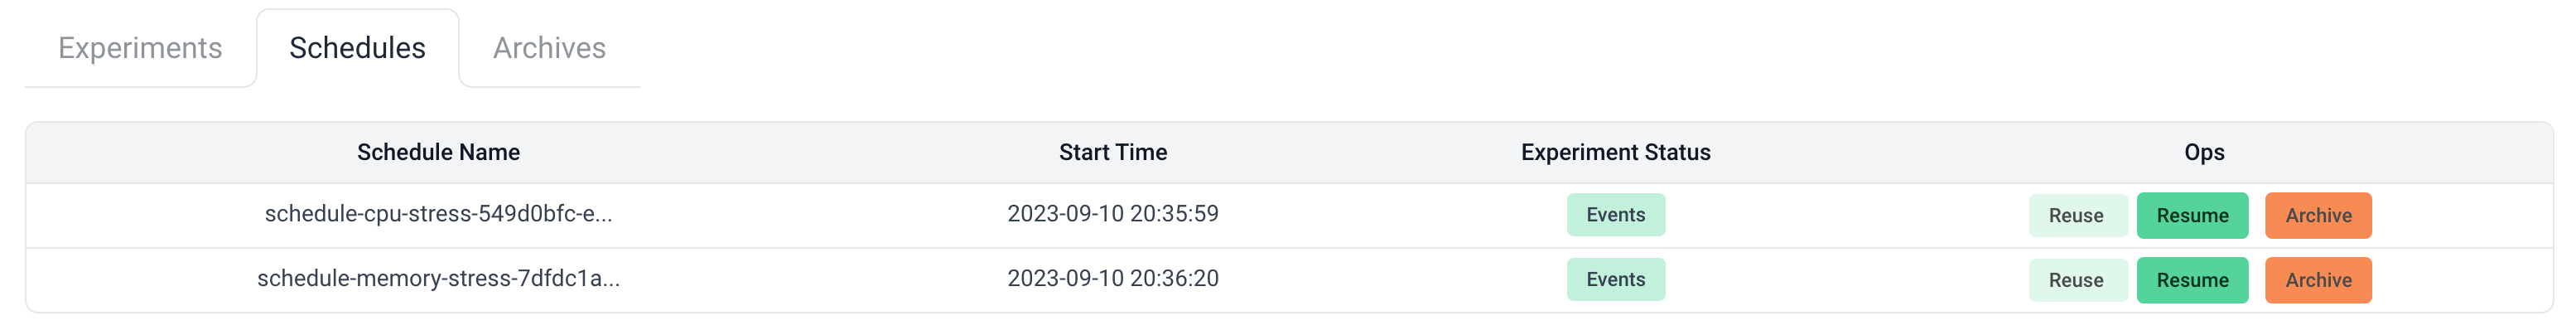
Schedules are periodic tasks that automatically create fault experiments at fixed times or intervals. The Schedules table has four columns, including:
-
Schedule Name: The name of the scheduled fault task, also automatically generated by the platform in the format of
schedule-type-uid, wheretypeis the type of fault injection, anduidis a unique identifier generated using UUID. -
Start Time: The start time of the scheduled fault task. Since scheduled tasks continue to execute until the user pauses/archives them, Schedules do not have a Duration field.
-
Events: Same as the Events in Experiments. Clicking the Events button allows you to retrieve the most recent events of the scheduled fault experiment. Attempting to retrieve Schedule events may result in the following error message:
Failed to get run time: too many missed start time (> 100). Set or decrease .spec.startingDeadlineSeconds or check clock skew.
Where
startingDeadlineSecondsis a concept in Cronjob, and the platform follows the default setting ofnull. This error message indicates that the CronJob controller has detected more than 100 missed executions from the previous scheduled time until now, and it will no longer execute the scheduled task. This error usually occurs when a user has paused a fault experiment for an extended period and attempts to resume it. Users can simply click Reuse to reuse the experiment, and the original experiment can be discarded through archiving. -
Ops: Schedule supports three operations, where Reuse and Archive are the same as the corresponding operations in Experiments. Once a Schedule task has started, the Pause button allows users to pause the Schedule, preventing it from creating new experiments and pausing the already created ones. After pausing, the Resume button can be used to resume the task.
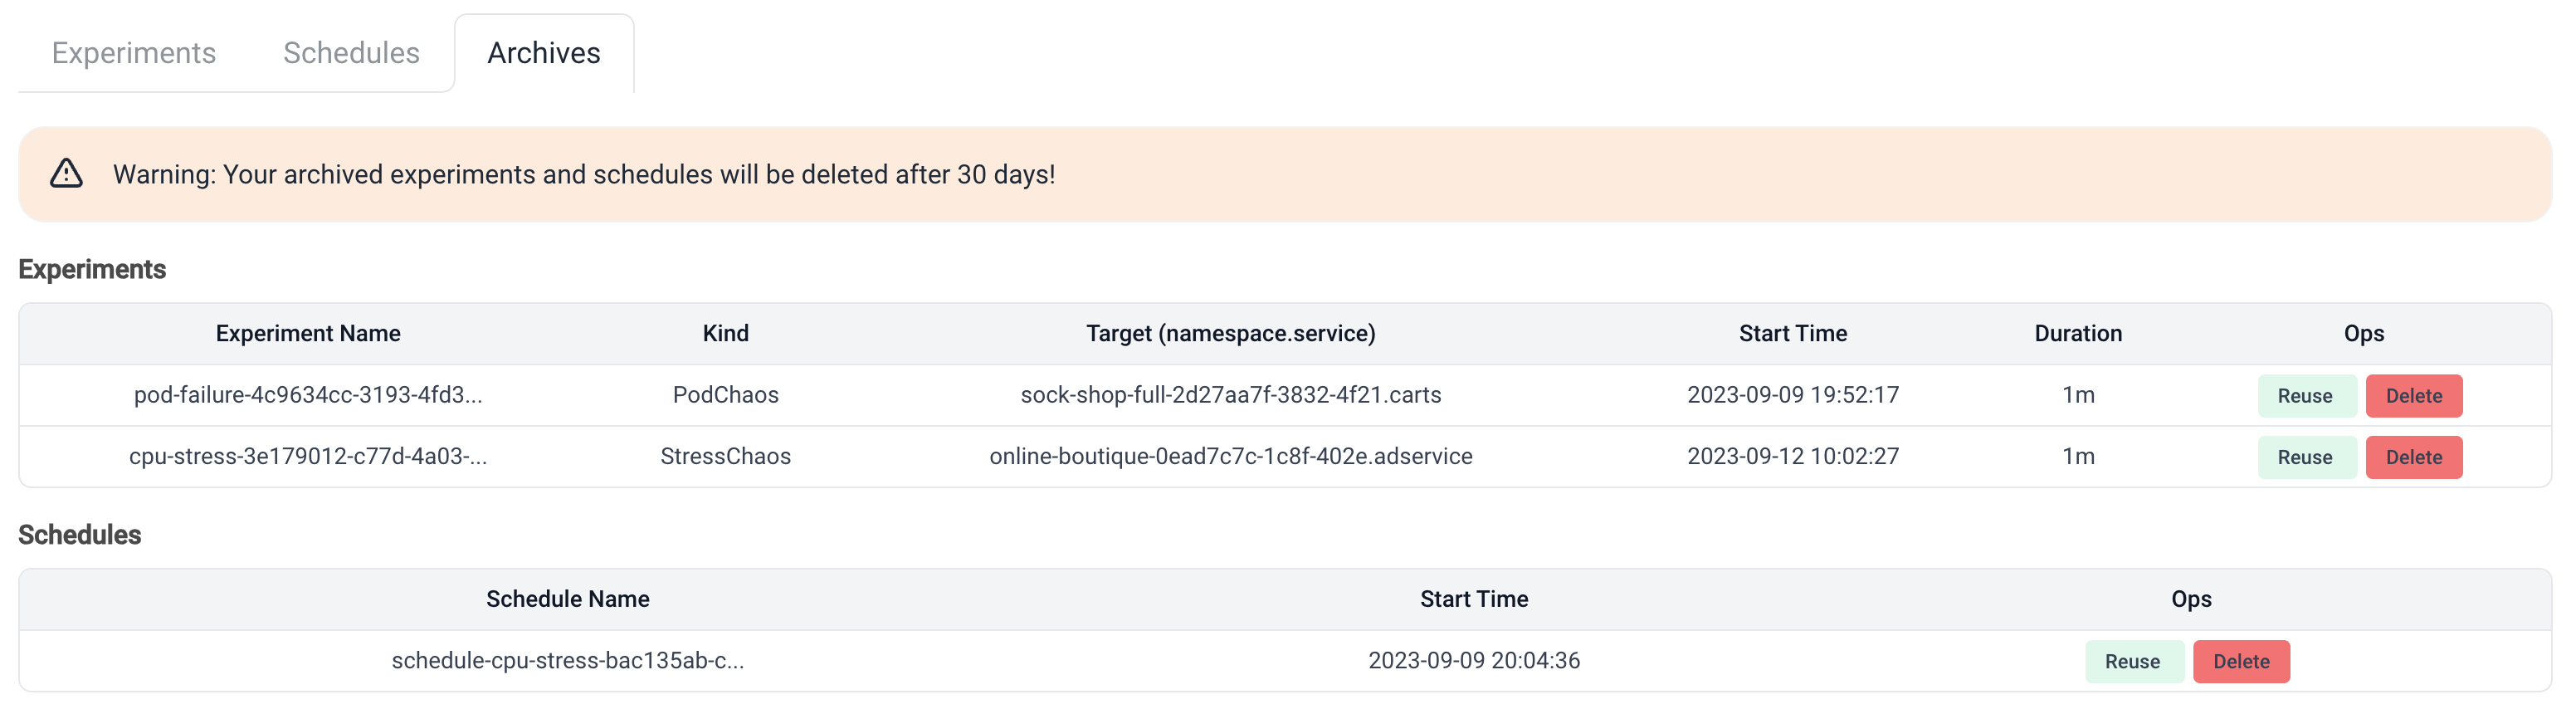
Archives are archived fault experiments, with the same table fields. However, the operations are slightly different. Archived experiments will be automatically permanently deleted 30 days after archiving, but users can also delete them manually.
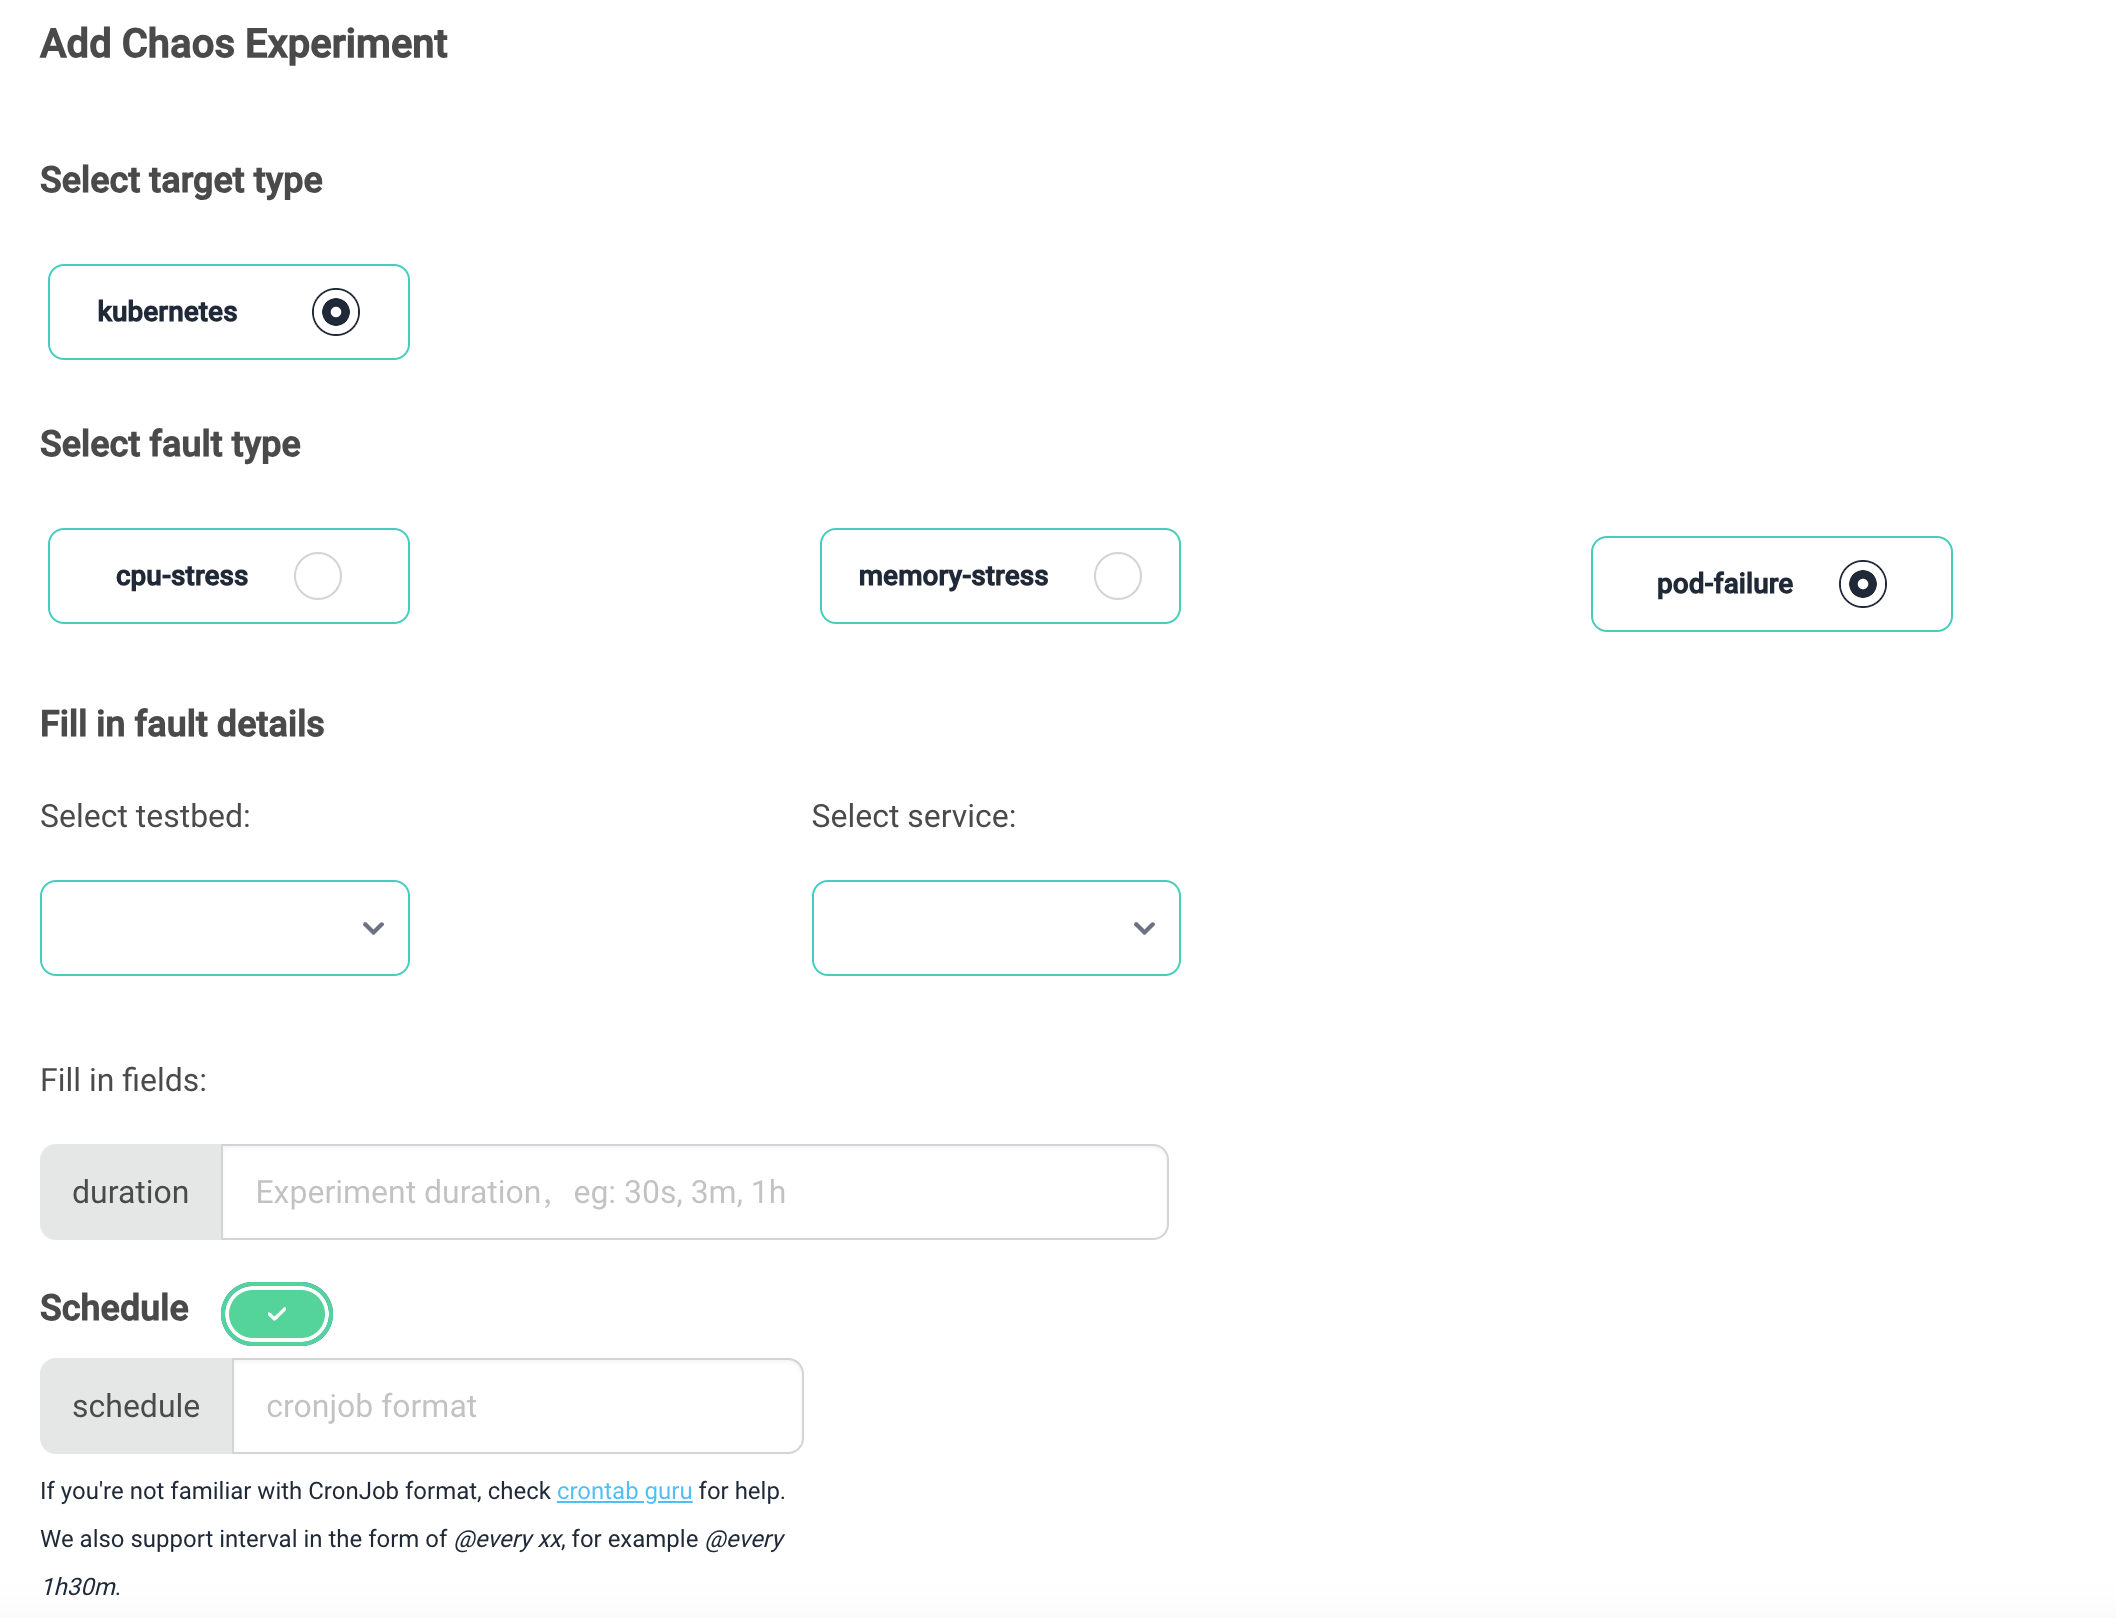
Clicking the Add button on the Chaos module's homepage takes you to the configuration page for fault injection. On this page, users can select the fault type, injection target, and timing interval.
Currently, we provide the three most commonly used fault types:
- pod-failure: Makes all pods in a specified service unavailable.
- cpu-stress: Simulates CPU stress on containers in a specified service.
- memory-stress: Simulates memory stress on containers in a specified service.
After selecting the fault type, the fields required for that fault will appear below. Users can fill in the information as prompted.
Users can only inject faults into services within their own created testbed. The injection page provides a dropdown list with all the user's testbeds and their corresponding services for selection.
By default, a single fault experiment is injected, and the scheduling switch is turned off. If you want to inject scheduled fault experiments, you can toggle the Schedule switch and provide the required Cronjob format content to describe the scheduling task.
Finally, click the Submit button at the bottom of the page to submit the fault injection experiment. The page will automatically redirect to the Chaos module's homepage for monitoring the experiment's status.
Dataset contains various datasets automatically collected by the platform.
In the Testbed section, we provide details about Testbed. If you haven't seen it yet, you may want to take a look.
After creating a Testbed, there will be many services, each composed of containers. MicroOps automatically collects and processes various metrics from these services and containers, then aggregates this data according to the Testbed.
You can only view datasets that belong to yourself and the public.
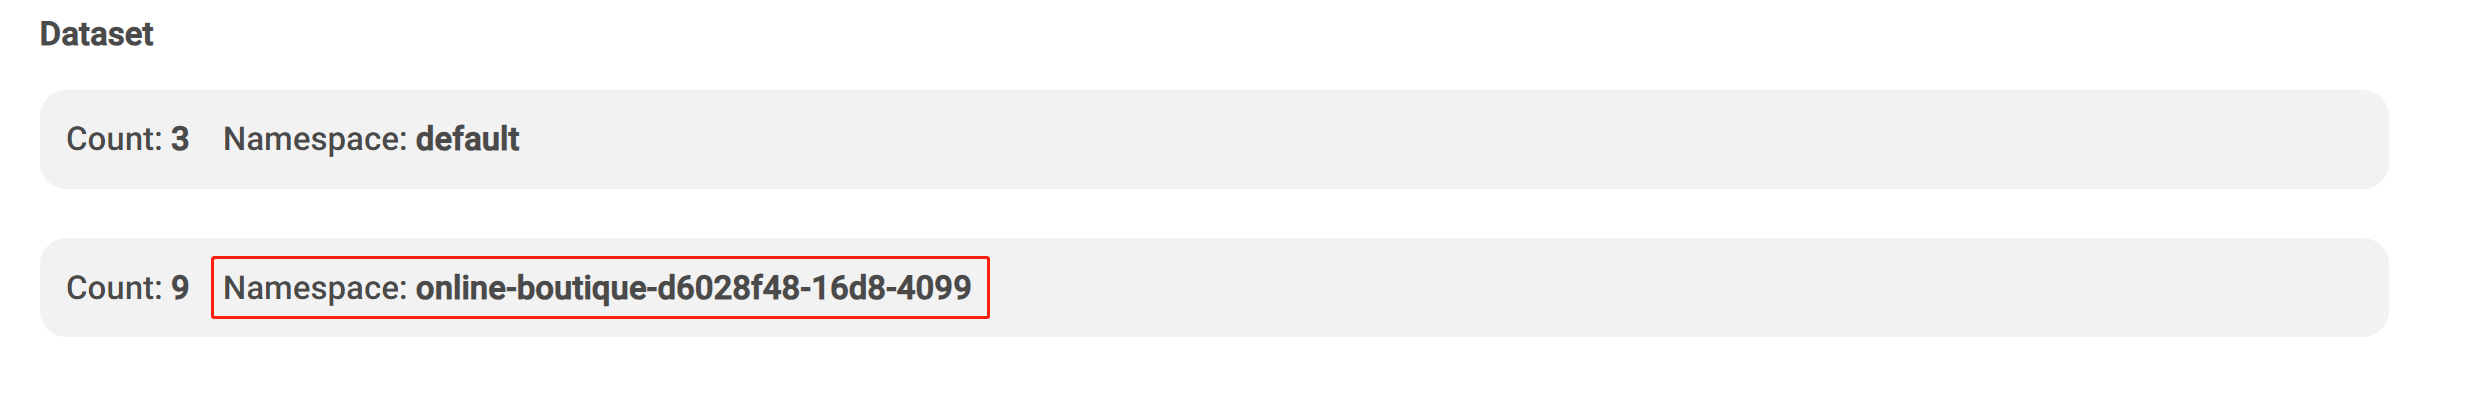
As shown in the image below, there are two namespaces: default and online-boutique-d6028f48-16d8-4099. In the default namespace, you can find some public datasets, such as various node metrics. In the online-boutique-d6028f48-16d8-4099 namespace, you can find other datasets belonging to the currently logged-in user, which are only visible to the user.

Preview

Download
Click on the Download button to download the dataset in CSV format for local use.
We will soon support users to access real-time data streams in MicroOps locally through an API.
Model contains a series of models, such as DLinear, Transformer, and more.
These models have been modified based on our SDK for easier integration with our platform.
After developing the model based on the SDK, it is packaged into a Docker container, and the platform retains links to the corresponding containers. For example, ts-lib:latest. In addition to this, the platform also stores a series of hyperparameters required for model training and inference.
During training or testing, users can modify these parameters according to their needs to meet their requirements.
If you want to develop your own model and integrate it into MicroOps, please refer to the SDK documentation.
For an model, you can choose to train or test.
Please refer to the respective sections for more details.
Click the ADD button to access the following page, where you need to fill in the following fields:
-
Name: Provide a name for your model.
-
Description: A brief description of your model.
-
URL: Specify the URL of the model image.
-
Hyperparameters: Enter the model's hyperparameters in JSON format.

Once you have entered the information, click the submit button to add the model.
This is the validation of model effectiveness.
Through the frontend, you can initiate a real-time task, monitor real-time data streams from Kafka, perform anomaly detection, and write the detection results to MongoDB. During this process, you can intervene in your Testbed using Chaos, such as injecting memory anomalies. The effects of these interventions will be reflected in the real-time data stream. If the model performs well, it will accurately capture these anomalies.
You can also evaluate the model's performance based on the injected anomalies and detected anomalies, calculating precision (P), recall (R), and F1 score.
Prerequisites
You must have a trained model.
Add
To add a detection task, you need to:
- Click the Add button. After clicking the button, a dialog as shown below will appear.
- Choose an model. Select the model you want to deploy.
- Select a training task. When you choose an model in the second step, the platform will automatically search for the corresponding training tasks. These training tasks correspond to pre-trained model weights. After selecting a training task, the data source will be automatically matched.
- Set the hyperparameters for the detection.
- Submit the task.

Use

After successfully adding a task, you should see a record as shown in the image above. At the end of the record, there are three buttons:
- Detail
- Delete
- Evaluation
Delete will remove the current detection task.

As shown in the image above, the Detail page contains various elements. The chart at the bottom represents the current real-time data source, with two fixed metrics, pred and chaos, representing the predicted anomaly intervals and the actual anomaly injection intervals, respectively. Other metrics are the features selected during model training. If a feature was not selected during training, it will not be displayed even if it exists in the data source.
In the image above, the yellow bars indicate detected anomalies.
Start End Offset
Start represents the data's start event displayed in the chart, while End is similar.
Offset, in conjunction with End, can determine Start and is often used to monitor the latest few minutes of information.
AutoRefresh and Refresh Interval
Control whether to enable automatic refresh and the interval for automatic refresh. You can also choose manual refresh.

Evaluation is responsible for assessing the detection performance of the current model.
Clicking the button will bring up a dialog. First, select the metrics you want to calculate, and then select the event range for calculation.
Training here is the same concept as traditional training, requiring both an model and a data source.
Simply perform operations on the frontend to initiate a training task, and the training output will be saved in Redis.
Under the Model tab, click the Add button to access the following page:

Simply:
- Choose a dataset.
- Select an model.
- Adjust the training fields and the range of training data.
- Adjust hyperparameters.
- Submit the task.
This will submit a training task. The platform will start a training job based on the parameters you've set and complete the training. After training, the model will be saved in Redis.
Datasets
You can see all datasets that belong to you and are public.
You can set the data range, choose fields, and so on.

models
Similarly, you can see models that belong to you and are public.
