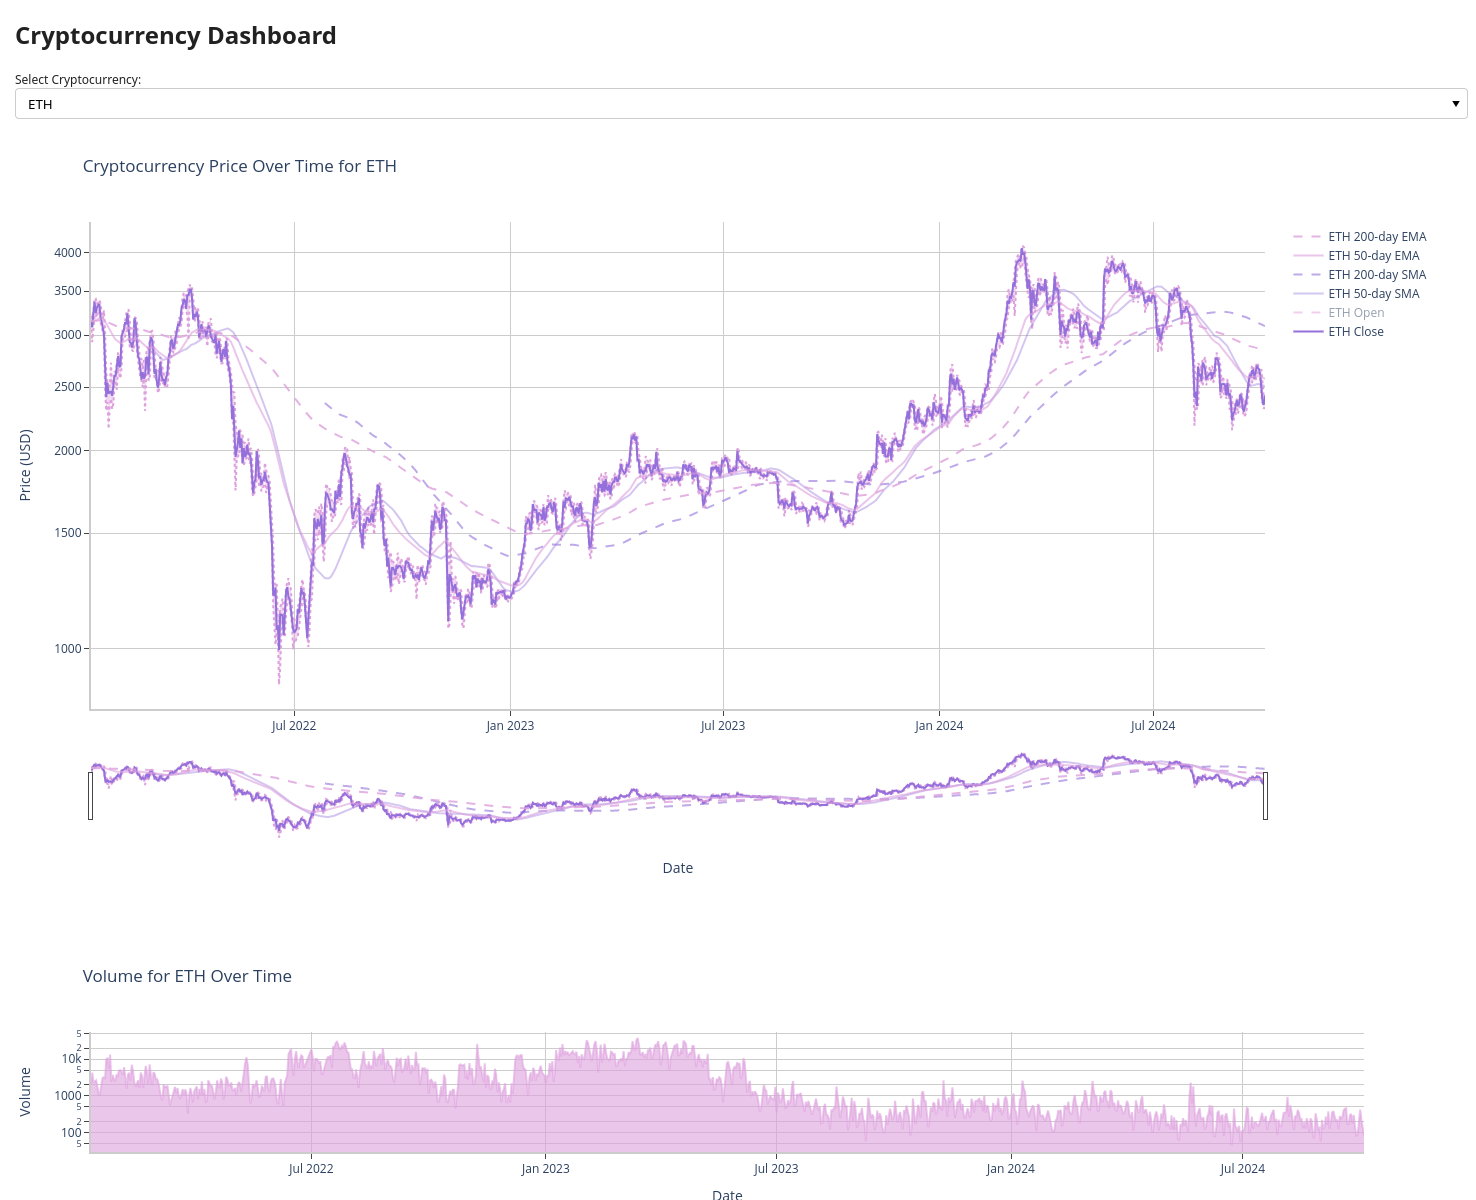
Simple finance dashboard to track and compare cryptocurrency prices written in Python.
Update: Complete overhaul in v1.2!
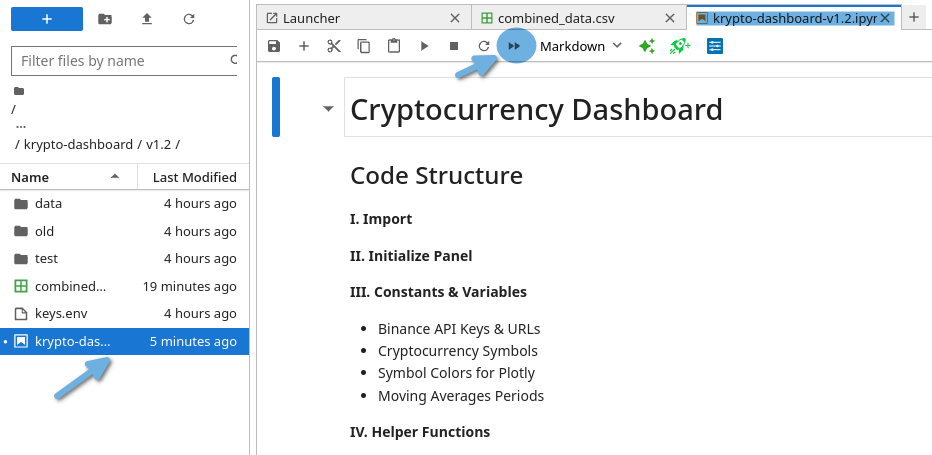
- Extensive Jupyter Notebook with full documentation.
- Use as a basis and create your own python script using the components you need.
Features:
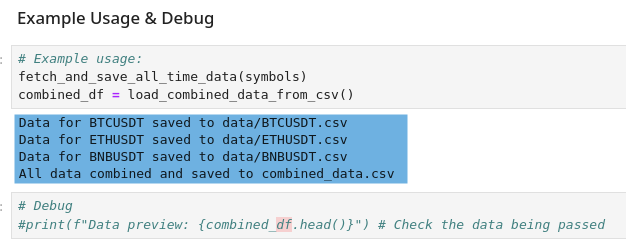
- Fetch cryptocurrency data from Binance.
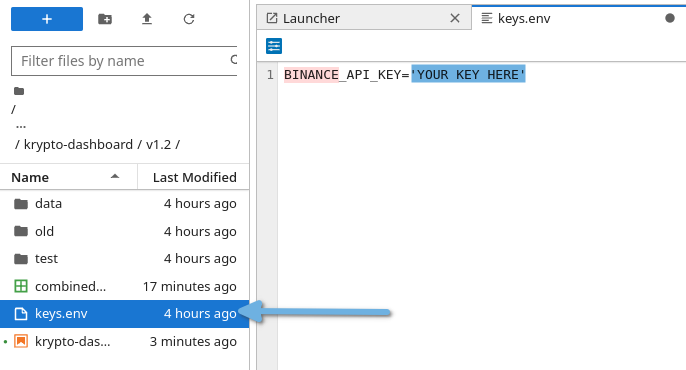
- Store API-Keys securely using dotenv.
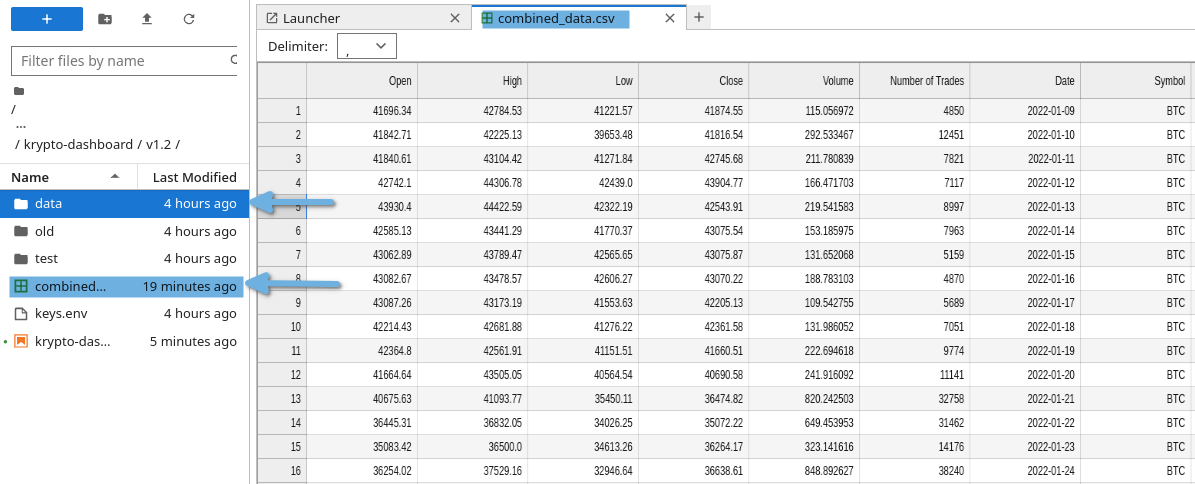
- Helper functions to extract data and save to CSV.
- Explore dataframes in Tabulate.
- Create plots in Plotly.
- Build dashboard in Panel.
Simple example dashboard (crypto_prices_over_time.ipynb) is hosted on Anaconda Cloud.
View Demo Dashboard App on Anaconda Cloud!
- load_dotenv
- datetime
- pandas
- panel
- plotly
- matplotlib
Install with pip:
pip install <PACKAGE_NAME>
Install with conda:
conda install --channel=conda-forge <PACKAGE_NAME>
Store your Public Binance API-Key in keys.env.
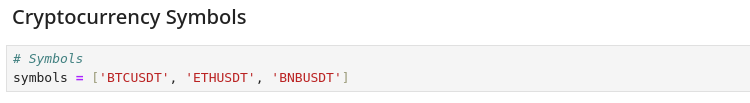
Go to Add Symbol section of the notebook and add custom Crypto-USDT-pairs.
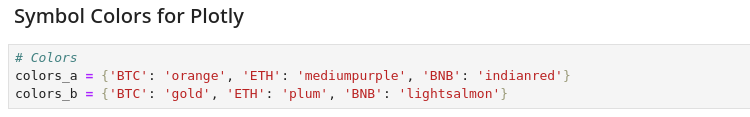
Pick custom colors for plotly using the matplotlib colors library and add to colors dictionaries.
https://matplotlib.org/stable/gallery/color/named_colors.html
Example data sets are available.
Run all cells first to guarantee full functionality.
Grab and check all data you need using the Main Function.
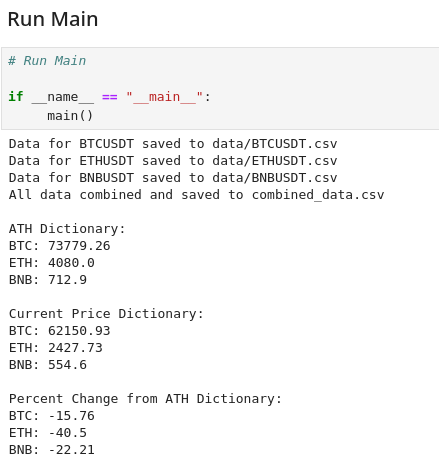
Save data locally as a csv file.
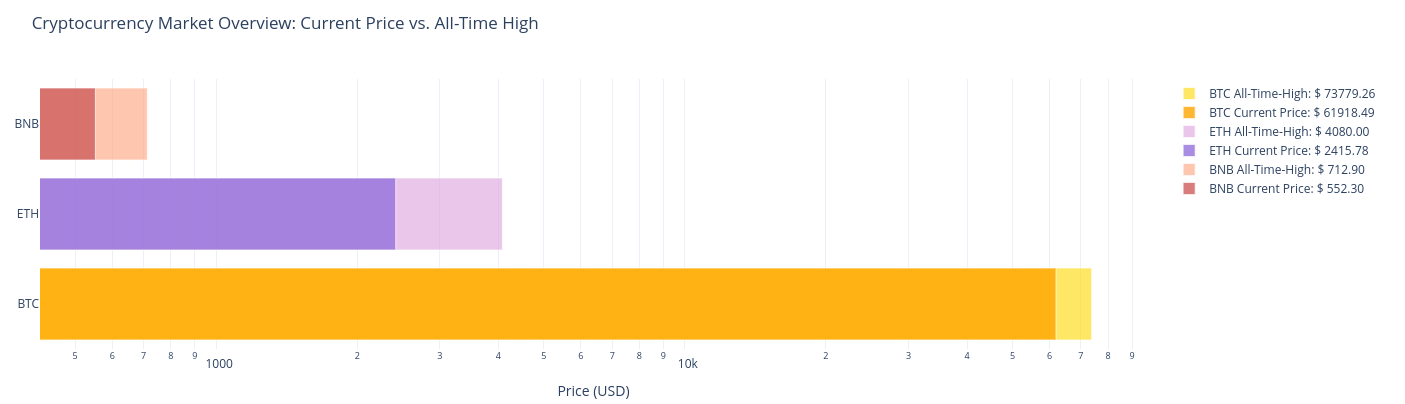
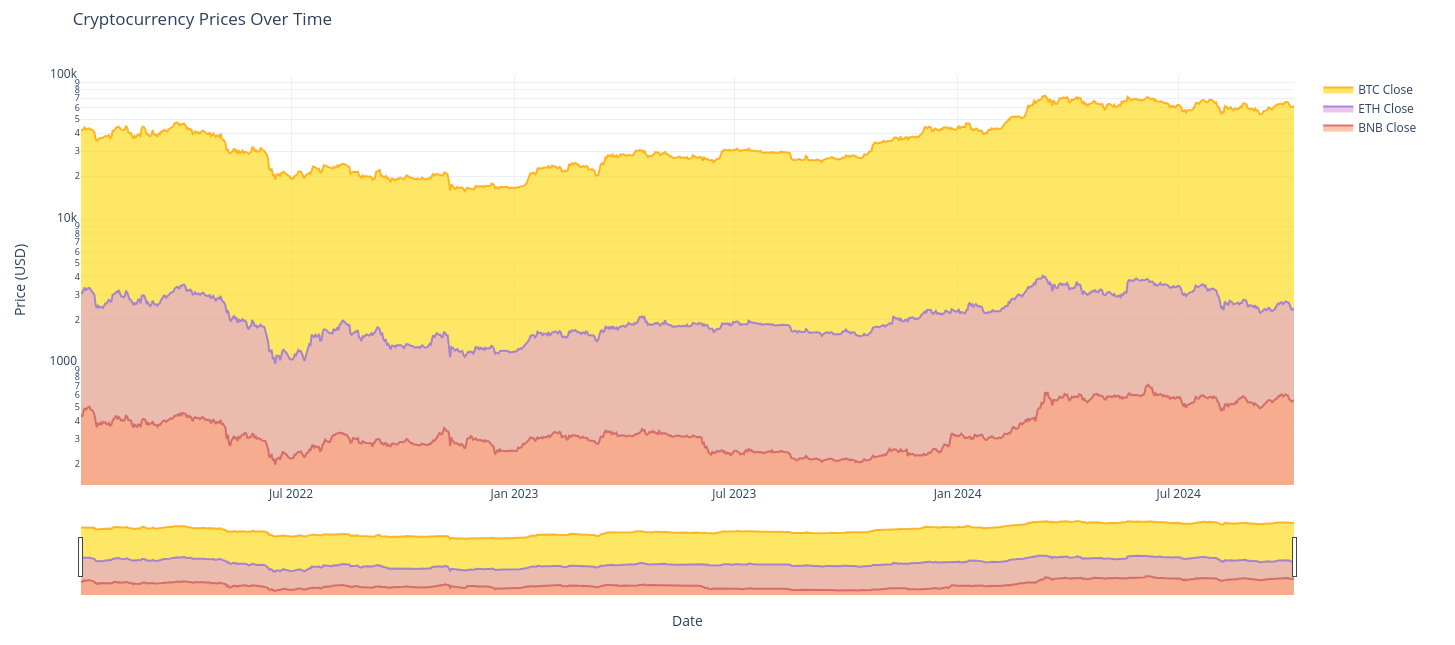
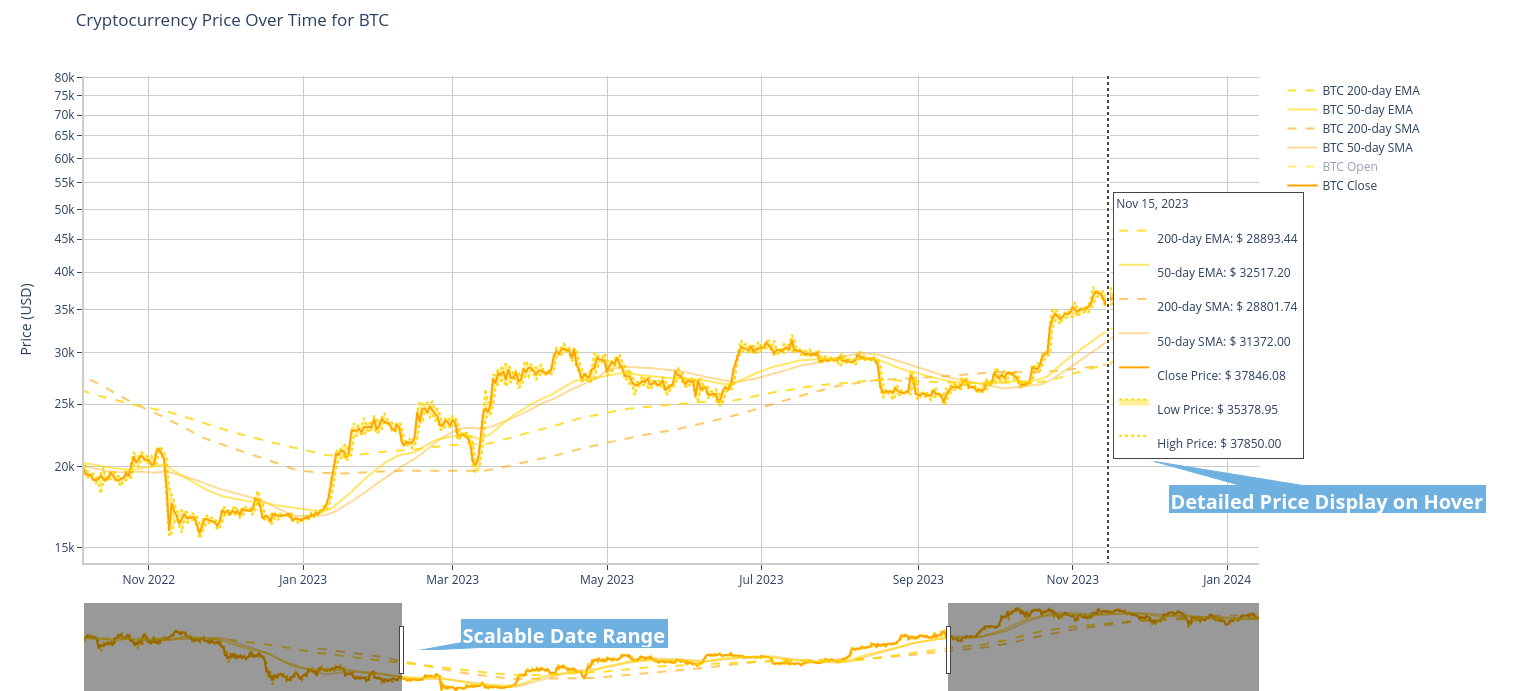
Generate nice looking charts with Plotly.
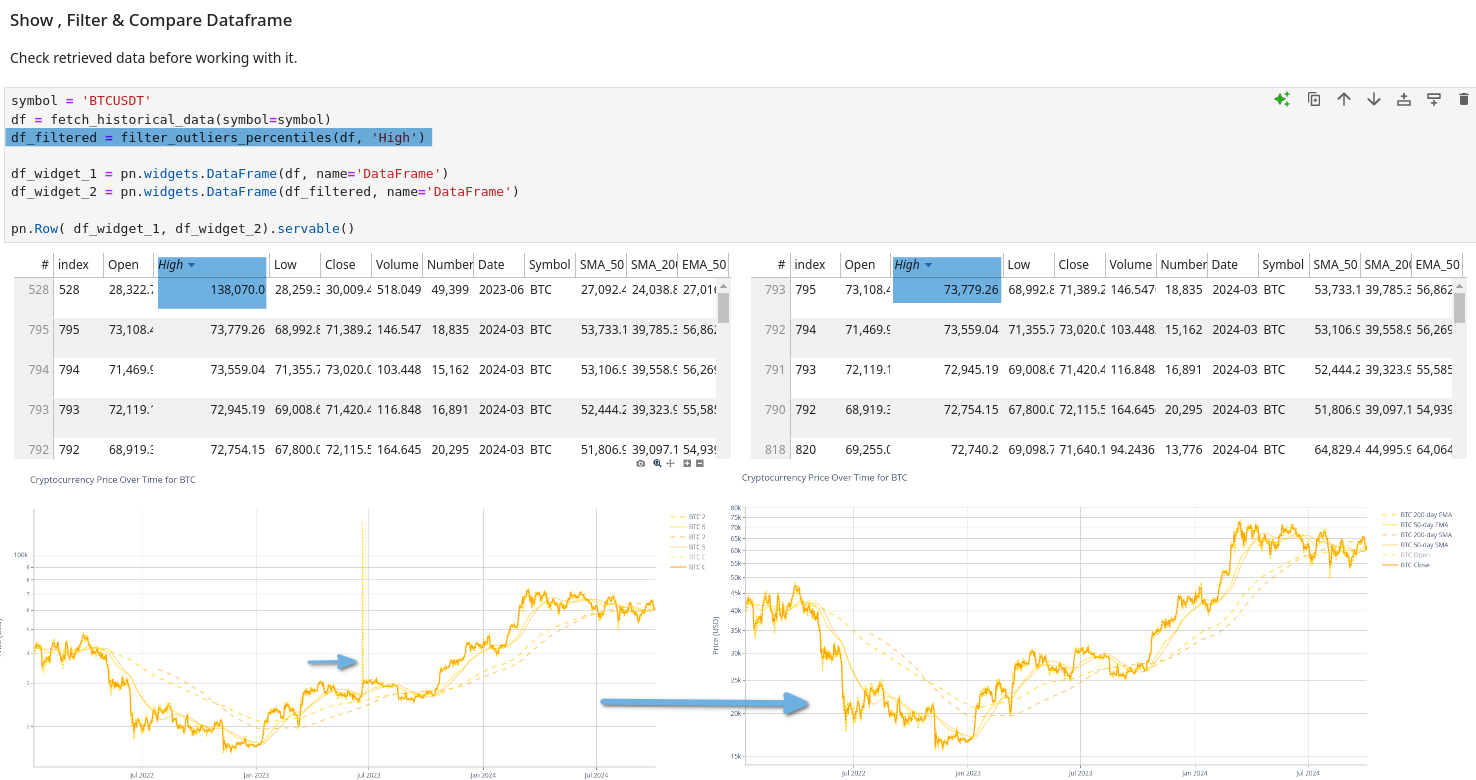
Explore & Compare data tables and apply filters if necessary.
Use interactive widgets to explore data in Jupyter Notebook or build a Dashboard App using Panel.