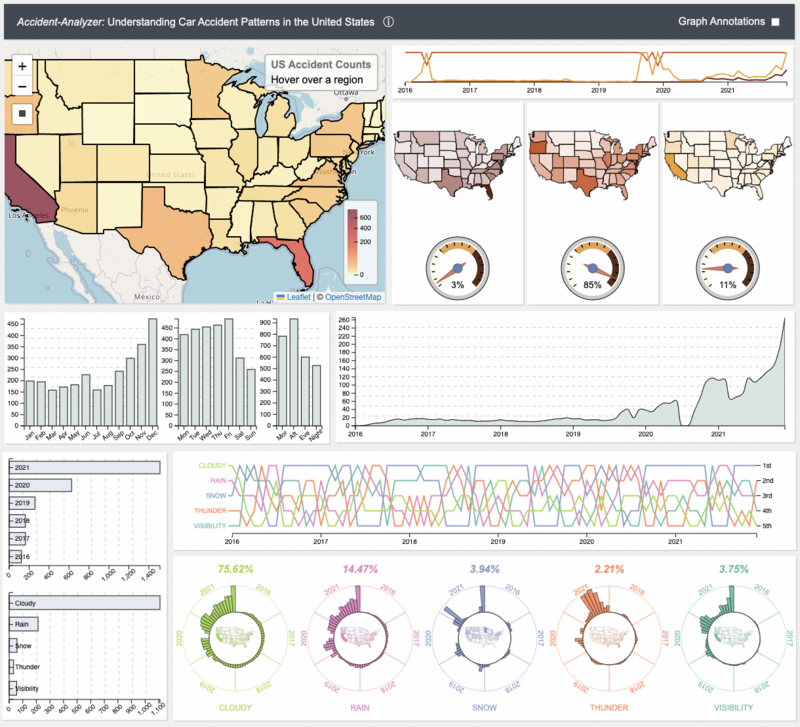
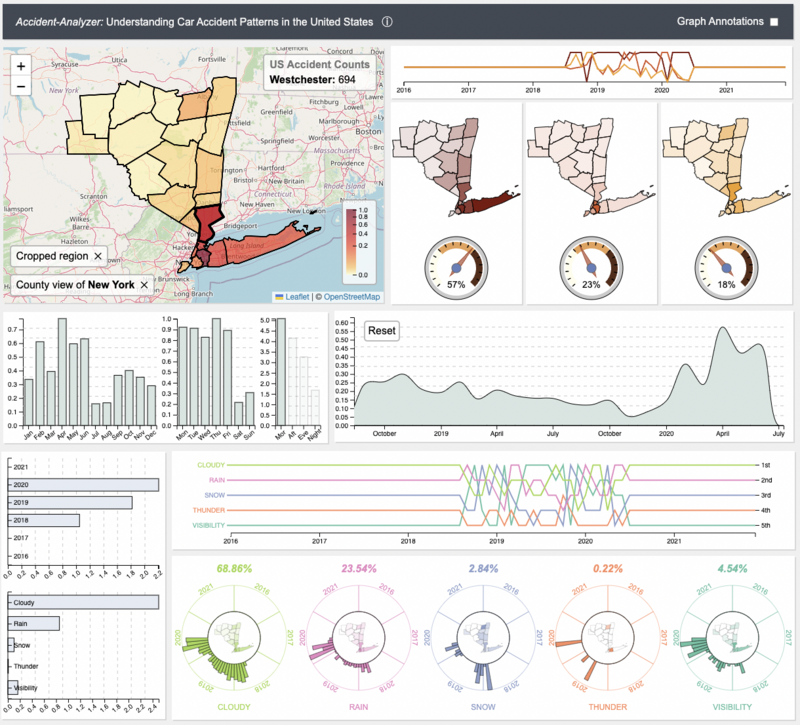
In this project, we reimagine CrimAnalyzer– a visualization assisted analytic tool for crimes in Sao Paulo– in the con- text of traffic accidents, ultimately producing Accident-Analyzer. In doing so, we explore the spatio-temporal patterns of traffic accidents across the United States from 2016 to 2021. The Accident-Analyzer system will allow users to identify local hotspots, visualize accident trends over time, and filter the data by key categories in real-time. Our goals in this project were to best recreate the analytic tool proposed in the CrimAnalyzer paper, as well as extend its capabilities to the US Accidents dataset, a collection of approximately 2.8 million car accidents covering 49 US states.
- Kyle Otstot (@kotstot6)
- Shreyash Gade (@shreyash1112)
- Jaswanth Reddy Tokala (@jaswanth1999)
- Anudeep Reddy Dasari (@anudeep-dasari)
- Hruthik Reddy Sunnapu (@hruthik-reddy)
- Nitesh Valluru (@vallurunitesh)
Client: D3.js (v7), Leaflet.js, Pyodide
Server: PHP, MySQL
A simple demonstration of the system can be found here.
Move to project directory, and clone the project
cd /path/to/project git clone https://link-to-projectDownload the CSV data here, and add it to the data directory of the project.
Install MySQL, and set the password for root. Add it to php/credentials.php
$password = "<YOUR-MYSQL-ROOT-PASSWORD>";Then run MySQL on terminal. For example, the MacOS command would be
/usr/local/mysql/bin/mysql -h localhost -u root -p --local_infileCreate a database with the following commands
  CREATE DATABASE us_accidents_database;
  USE us_accidents_database;
Create a table with the following command
  CREATE TABLE us_accidents (
      Timestamp datetime,
      Year int,
      Month int,
      Day int,
      Time_of_Day int,
      Day_of_Week int,
      Duration int,
      Distance float,
      County int,
      State int,
      Cloudy int,
      Rain int,
      Snow int,
      Precipitation int,
      Thunder int,
      Visibility int
  );
Then add the CSV data to the table
  SET GLOBAL local_infile = true;
  LOAD DATA LOCAL INFILE '/path/to/project/data/us_accidents.csv'
  INTO TABLE us_accidents
  FIELDS TERMINATED BY ','
  ENCLOSED BY '"'
  LINES TERMINATED BY '\n'
  IGNORE 1 ROWS;
If successful, 2845341 rows should have been added.
Now install PHP and run the following commands
cd /path/to/project php -S localhost:8080Lastly, enter localhost:8080 into your browser (e.g., Chrome) and the visualization should appear.
Note: If MySQLi errors are given, make sure that (insert mysqli term) these two commands(extension=mysqli and extension_dir="ext") are uncommented in the php.ini file. Furthermore, if the PHP execution times out, try adjusting (increase the max_execution_time and max_input_time) in the php.ini file. Also if you are using php 5.3 and above you may need to rename the 'php.ini-production' file to 'php.ini'
Garcıa, Germain and Silveira, Jaqueline and Poco, Jorge and Paiva, Afonso and Nery, Marcelo Batista and Silva, Claudio T. and Adorno, Sérgio and Nonato, Luis Gustavo, CrimAnalyzer: Understanding Crime Patterns in São Paulo. IEEE Transactions on Visualization and Computer Graphics, 2021