This project analyzes school performance across a district using Python and Pandas. By aggregating and manipulating standardized test data, we identify trends in student achievement based on factors such as school type, budget, and student demographics.
- Data Wrangling: Cleaning and organizing large datasets using Pandas
- Data Aggregation: Computing summary statistics with
.groupby() - Conditional Analysis: Using logic to segment performance data
- Visualization: Presenting trends using DataFrames and Matplotlib
- Critical Thinking: Identifying key patterns in education data
- Schools with lower spending per student tend to achieve higher average scores and better passing rates.
- Schools spending less than $585 per student had the highest passing rates:
- Reading: 96.61%
- Math: 93.46%
- Overall: 90.36%
- Schools spending $645–$680 per student had significantly lower passing rates:
- Reading: 81.13%
- Math: 66.16%
- Overall: 53.52%
- This suggests that higher spending does not guarantee better academic outcomes and raises questions about resource efficiency.
- Smaller and medium-sized schools generally perform better than large schools.
- Average Math Scores:
- Small schools (<1,000 students): 83.82
- Medium schools (1,000–2,000 students): 83.37
- Large schools (>2,000 students): Lower scores
- Average Reading Scores:
- Medium-sized schools performed slightly better than both small and large schools (83.86).
- This pattern suggests that smaller schools provide more personalized instruction, improving student outcomes.
- Charter schools consistently outperform district schools.
- Average Scores:
- Math: Charter (83.47) vs. District (76.96)
- Reading: Charter (83.90) vs. District (80.97)
- Passing Rates:
- Charter Schools: 90.43% overall
- District Schools: 53.67% overall
- The data suggests that charter schools may have more effective academic programs and resource allocation.
The analysis follows these key steps:
import pandas as pd
from pathlib import Path

# Load datasets
school_data = pd.read_csv("Resources/schools_complete.csv")
student_data = pd.read_csv("Resources/students_complete.csv")

# Merge datasets
school_data_complete = pd.merge(student_data, school_data, how="left", on=["school_name"])
# Total number of schools
school_count = len(school_data_complete["school_name"].unique())

# Total number of students
student_count = len(school_data_complete["student_name"].unique())

# Total Budget
total_budget = school_data_complete.groupby("school_name")["budget"].first().sum()

# Avg math and reading scores
average_math_score = school_data_complete["math_score"].mean()
average_reading_score = school_data_complete["reading_score"].mean()

# Percentage of students passing math and reading
passing_math_reading_count = school_data_complete[
    (school_data_complete["math_score"] >= 70) & (school_data_complete["reading_score"] >= 70)
].count()["student_name"]
overall_passing_rate = passing_math_reading_count /  float(student_count) * 100
overall_passing_rate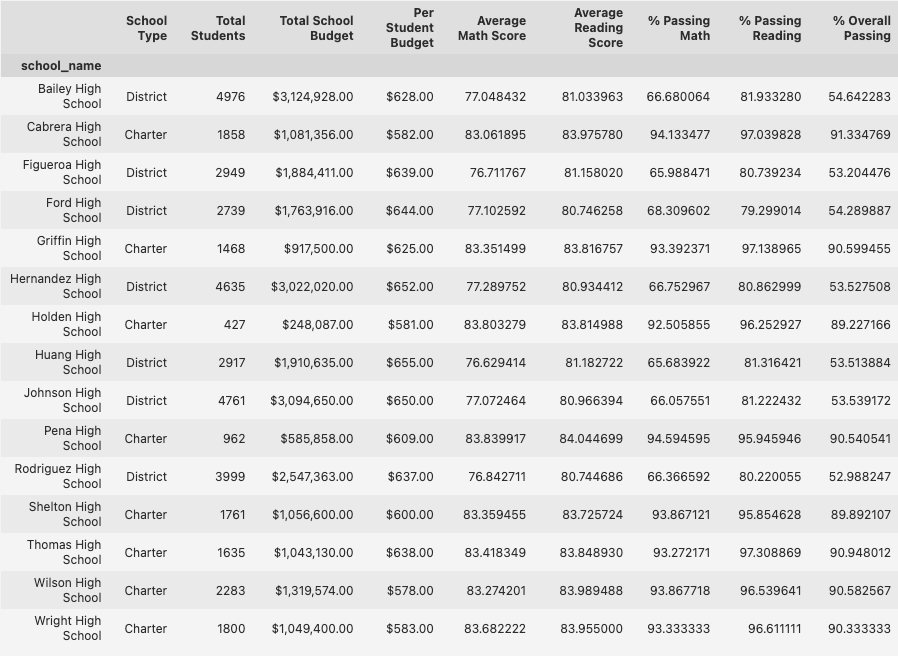
# School type, total students, total budget, per-student budget
school_types = school_data.set_index("school_name")["type"]
per_school_counts = school_data.set_index("school_name")["size"]
per_school_budget = school_data.set_index("school_name")["budget"]
per_school_capita = per_school_budget / per_school_counts

# Avg math and reading scores
per_school_math = school_data_complete.groupby('school_name')['math_score'].mean()
per_school_reading = school_data_complete.groupby('school_name')['reading_score'].mean()

# Students passing math and reading
students_passing_math_and_reading = school_data_complete[
    (school_data_complete["reading_score"] >= 70) & (school_data_complete["math_score"] >= 70)
]
school_students_passing_math_and_reading = students_passing_math_and_reading.groupby(["school_name"]).size()
print(school_students_passing_math_and_reading)- Python
- Pandas (Data manipulation)
- Jupyter Notebook (Interactive analysis)
- Chat GPT