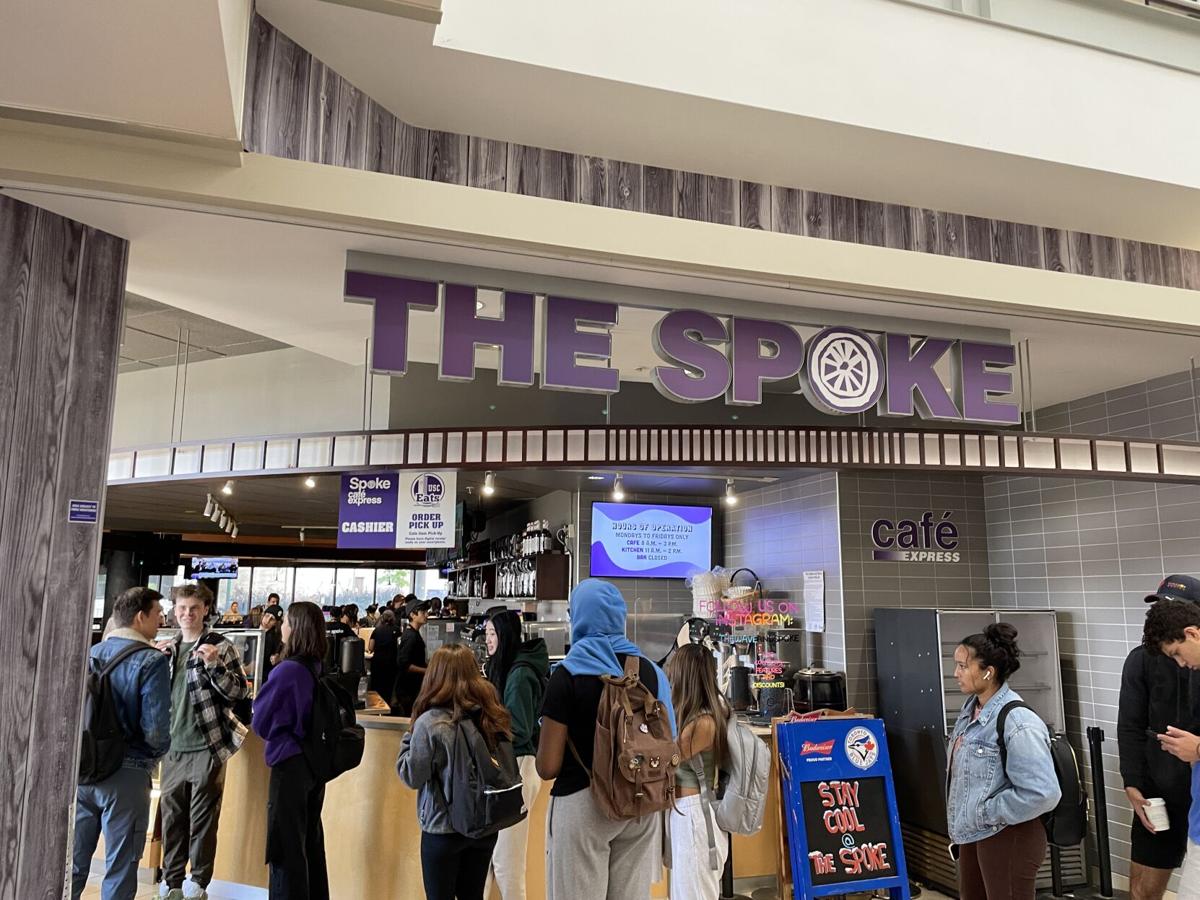
In 2017, Western enrollment was ~28.7k students. Five years later, enrollment is up ~40%, reaching ~39.8k students. Students have been ill-prepared as we've returned to campus after roughly two years of remote or hybrid. Long lines at Tim Horton's and Spoke and no study spots across Engineering Buildings, Libraries, and General Common areas increase the time away from the books.
The inspiration for this system was to solve just that; with numerous food and study options and constantly changing dynamics of where students are, making these decisions has only become more complex. Tally looks to be a digital tool in the ever-growing roster of tools supporting education to make students' lives easier and help them be more aware.
Tally provides students and other campus visitors with an easy-to-use application that allows them to view real-time occupancy and queue length across different buildings/areas on campus. The key goal is to allow a user to make an informed decision on where to go and when to go to a specific building to optimize time and avoid large crowds. The system uses a combination of a low-cost camera node, a CNN, and an impressive front-end UI to provide a coherent understanding of the occupancy.
Our system can be divided into three main components:

- ESP-32 boots up; connects to camera and external WiFi resource
- Captures the picture at a pre-programmed interval (for test purposes, it was ~30s and would hover around ~15min)
- Splits the image into a data stream and sends it as a JSON stream to a remote endpoint; restarts at step 2
Hosted the project on an EC2 instance and created an RDS instance with a MySQL database.
We additionally connected the backend to the frontend using custom REST endpoints via Express.js.


- Trained and tested the model using publicly available crowd control data; Kaggle dataset
- Exported the model and queued it up to take requests for images
The frontend was built with React.

- Deploying the trained model to the cloud; it was both a large model file (~3.5GB), and within our initial design, it required to be repeatedly called
- Given the ESP-32 sends images via a UDP data stream, data loss was somewhat common; determining when an image was un-usable before blocking the Tensorflow Serving
- Different resolution from the Kaggle dataset vs what the ESP32 was outputting; required a stronger understanding of Image libraries and resizing the image
- Asynchronous requests, via Axios, in React, along with the Google Maps API, was a complex experience
- Querying the database in a rapid manner to reduce lag was a key priority
- Connecting all the complex components together, we have a hardware portion (ESP-32), a CNN (Tensorflow), a relational database (MySQL), a REST API (Express.js), and a front-end (React.js), each working seamlessly together
- A beautiful UI
- The model; was hard to train to a reputable accuracy
- Integrating an overlay onto Google Maps API with React; turned out to be a bit more complex than we expected
- Became much more comfortable/better at React; understanding better component design and trees
- Put some of our ECE4436 knowledge to practice with trying to understand packet sending
- Learned the importance of how subsystems interact with each other; input/output between these systems are compatible, succinct, and efficient
- Better casing for the device; it was hard to test out to get a good angle; trying to put the camera and hardware (along with a battery potentially) could make it easier to work with; printing out a 3D model of the casing would be a logical next step
- Advancing the model further as we collect more relevant data; people sitting vs standing
- Fleshing out the front end more so we can provide more complex insights; for example, what's the fastest burger option? Would look at current and paste queue times, distance travelled, etc.
- Providing an admin dashboard for Western and other campuses to view their usage of different buildings