-
Notifications
You must be signed in to change notification settings - Fork 2.6k
Debugging Git
First of all, Git's .exe files should be rebuilt with debugging information, and without optimization (because gdb has serious troubles single-stepping code compiled using -O2 for some reason). To this end:
- install the Git for Windows SDK
- edit
/usr/src/git/Makefileto remove the-O2from theCFLAGS = -g -O2 -Wallline, - run
makein/usr/src/git/.
After that, you can run Git's executables in GDB like so:
gdb --args ./git.exe --exec-path=/usr/src/git rev-parse HEADSometimes it is useful to ask the debugger to pause the program when the code path is entered that outputs an error message. The functions in Git that output error messages are error_builtin() and die_builtin(). So you can set the breakpoints
b error_builtin
b die_builtin
before calling run in gdb to stop execution at the appropriate time.
First, install emacs and run it:
$ pacman -S mingw64/mingw-w64-x86_64-emacs
$ emacs
Then type: ESC-x gdb RETURN
It should then prompt you to enter the name of an executable. Give it the full path to the actual executable (such as C:\git-sdk-64\mingw64\libexec\git-core\git-test-dump-index.exe or just git.exe if you want to debug a builtin).
You should get the usual gdb startup banner. At the first prompt, type pwd. For some reason it starts up in the exe's directory rather than the CWD of the shell. So you can cd to the root of the repo you want to work with.
For help, type help.
Type apropos word to search for commands related to "word"...
Reading symbols from c:/git-sdk-64/mingw64/libexec/git-core/git-test-dump-index.exe...done.
(gdb) pwd
Working directory c:\git-sdk-64\mingw64\libexec\git-core.
(gdb) cd e:/testrepo
Working directory e:\testrepo.
(gdb) pwd
Working directory e:\testrepo.
(gdb) b main
Breakpoint 1 at 0x4018da: file test-dump-index.c, line 57.
(gdb) r
Starting program: c:\git-sdk-64\mingw64\libexec\git-core\git-test-dump-index.exe
[New Thread 13028.0x3a50]

Breakpoint 1, 0x00000000004018da in main (argc=1, argv=0x6e0498) at test-dump-index.c:57
57     int main(int ac, char **av)
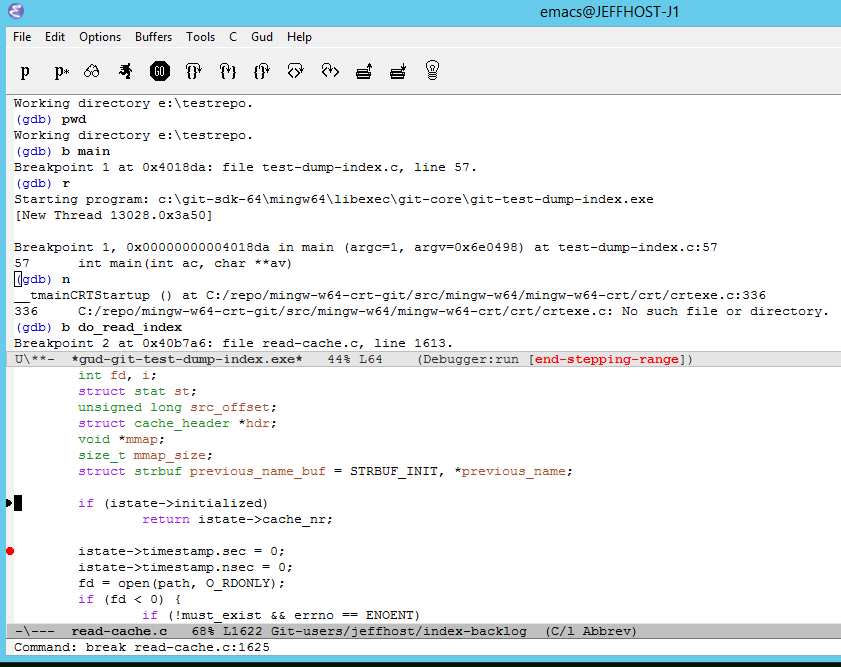
You can then debug like normal (for gdb), but with a split screen and the source in the other panel. there are some toolbar helpers and you can set breakpoints using the left gutter.
Screenshot:

This is the Git for Windows wiki. See how-to-participate.