COVID-19 Italy Monitor | #StayAtHome

Versione Italiana qui
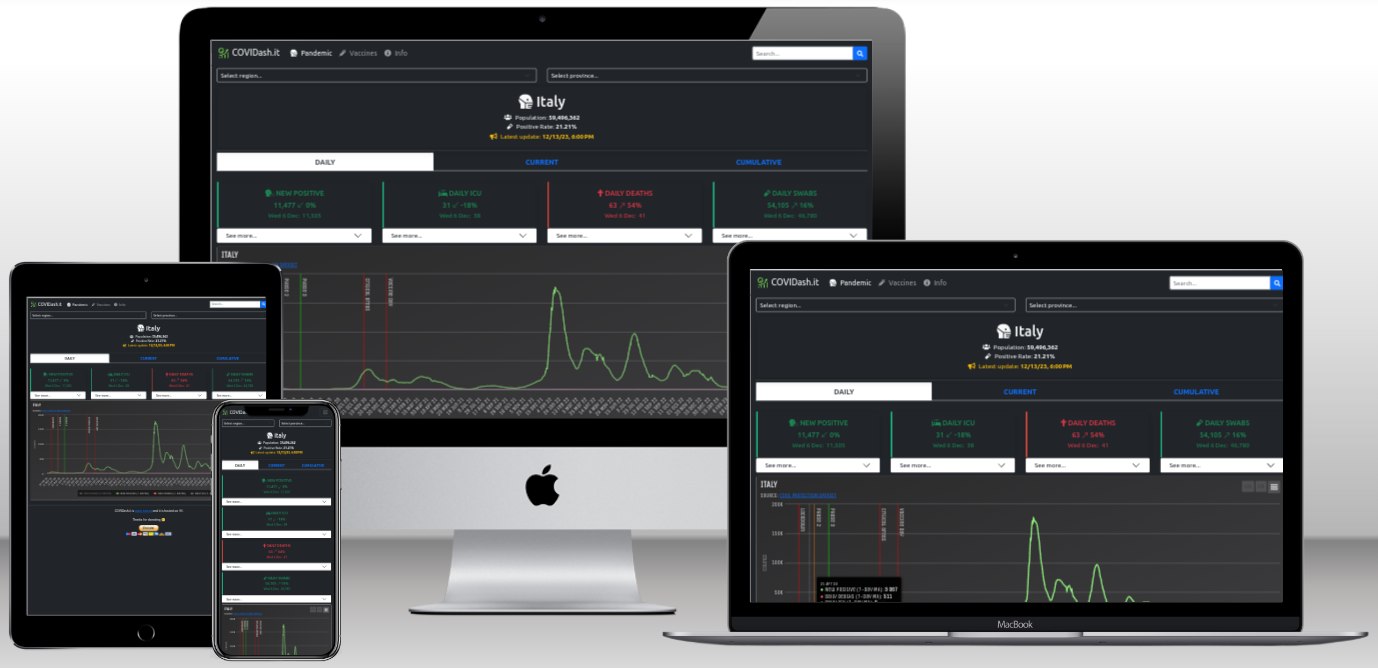
A simple dashboard to display and monitor the official data of the COVID-19 outbreak in Italy released by the Civil Protection Dept. and updated on a daily basis.
The app is deployed on Heroku here
Pandemic data from the official CP Dept repository
Vaccine data from the official open-data repository/
The WebApp requires Python 3.8+ and reads the data from a mongoDB. It employs a Flask server with gunicorn in front of it.
Furthermore, it employs Flask-babel for the italian translation, as English is set as primary language.
The script make_pot.sh creates the files needed by Babel for the translations.
A Batch version of the script is provided for Windows users.
The app language is decided upon the client request (browser / OS).
The front-end lives under covidashit/templates and it uses JS to create the chart object,
which is built using HighCharts.
In order for the app to be operational, a mongoDB must be populated
(see here for the creation of an Atlas mongoDB free cluster).
Additionally, mongo collections must be updated on a daily basis. The Flask contains a number of API whose purpose is to
update the DB every time the master branch of the CP Dept repository is updated, via a GitHub webhook (see the GitHub workflow here).
Ultimately, the webhooks for the following APIs must be set on the CP forked repository:
POST /update/nationalPOST /update/national/seriesPOST /update/national/trendsPOST /update/regionalPOST /update/regional/breakdownPOST /update/regional/seriesPOST /update/regional/trendsPOST /update/provincialPOST /update/provincial/breakdownPOST /update/provincial/seriesPOST /update/provincial/trendsPOST /update/vax/POST /update/vax/summary
- create and activate a virtual environment (follow this)
- install the requirements in
requirements.txt
The .env file contains all the env vars needed by the webapp.
In particular, the MONGO_URI and the various collection names string must be set.
Before the Flask server is started, but after the virtual environment has been activated,
the DB must be populated.
For this purpose a Flask CLI, that populates the various collections, is included.
This, with a very basic ETL procedure, will populate the various collections on
the DB with the official data released by the Civil Protection Dept.
Clone the repo, cd into it, activate the virtual environment, and run the procedure
flask create-collectionsthen run the worker
celery -A celery_worker.celery workerand, in a new shell, run the application server
flask runFlask will be listening at http://127.0.0.1:5000
First, replace the value of APPLICATION_ENV in .env with production
to test the Procfile configuration, Simply run the heroku CLI
heroku localTo test the containerization locally spawn the container with:
docker-compose up -dThe docker container will be listening at http://127.0.0.1:PORT with PORT
being set in the .env file
Stop it with
docker-compose downThe app can be deployed on Heroku either as a docker container or simply using the Procfile
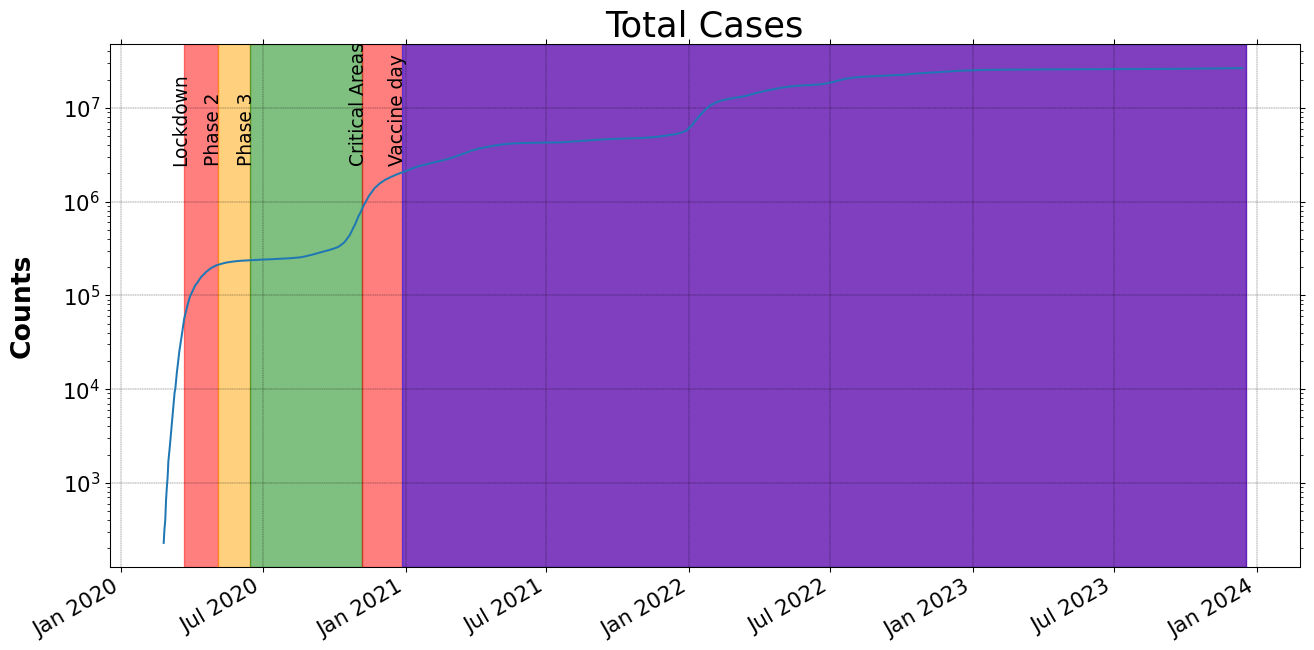
The app provides an API to produce a server-side plot with matplotlib.
The API can return a JSON response with the base64-encoded image, or
the bytes content to be saved as a file.
https://www.covidash.it/api/plot
data_type = [national, regional, provincial]
varname = [nuovi_positivi, ingressi_terapia_intensiva, deceduti_g, tamponi_g,
 totale_ospedalizzati_g, nuovi_positivi_ma, deceduti_g_ma,
 ingressi_terapia_intensiva_ma, tamponi_g_ma, totale_ospedalizzati_g_ma,
 totale_positivi, terapia_intensiva, ricoverati_con_sintomi,
 totale_ospedalizzati, isolamento_domiciliare, totale_casi, deceduti,
 tamponi, dimessi_guariti]
for data_type = [national, regional]
varname = [nuovi_positivi, nuovi_positivi_ma, totale_casi]
for data_type = [provincial]
area = [Abruzzo, Basilicata, Calabria, Campania, Emilia-Romagna, Friuli Venezia Giulia,
 Lazio, Liguria, Lombardia, Marche, Molise, Piemonte, Puglia, Sardegna,
 Sicilia, Toscana, P.A. Bolzano, P.A. Trento, Umbria, Valle d'Aosta, Veneto]
area = [Chieti, L'Aquila, Pescara, Teramo, Matera, Potenza, Catanzaro, Cosenza,
Crotone, Reggio di Calabria, Vibo Valentia, Avellino, Benevento, Caserta,
Napoli, Salerno, Bologna, Ferrara, Forlì-Cesena, Modena, Parma, Piacenza,
Ravenna, Reggio nell'Emilia, Rimini, Gorizia, Pordenone, Trieste, Udine,
Frosinone, Latina, Rieti, Roma, Viterbo, Genova, Imperia, La Spezia, Savona,
Bergamo, Brescia, Como, Cremona, Lecco, Lodi, Mantova, Milano,
Monza e della Brianza, Pavia, Sondrio, Varese, Ancona, Ascoli Piceno, Fermo,
Macerata, Pesaro e Urbino, Campobasso, Isernia, Alessandria, Asti, Biella,
Cuneo, Novara, Torino, Verbano-Cusio-Ossola, Vercelli, Bari,
Barletta-Andria-Trani, Brindisi, Lecce, Foggia, Taranto, Cagliari, Nuoro,
Sassari, Sud Sardegna, Agrigento, Caltanissetta, Catania, Enna, Messina,
Palermo, Ragusa, Siracusa, Trapani, Arezzo, Firenze, Grosseto, Livorno, Lucca,
Massa Carrara, Pisa, Pistoia, Prato, Siena, Perugia, Terni, Aosta, Belluno,
Padova, Rovigo, Treviso, Venezia, Verona, Vicenza]
GET /api/plot?data_type=national&varname=<varname>
GET /api/plot?data_type=regional&area=<region>&varname=<varname>
GET /api/plot?data_type=provincial&area=<province>&varname=[nuovi_positivi,nuovi_positivi_ma,totale_casi]>
curl --request GET \
     --url 'https://www.covidash.it/api/plot?data_type=national&varname=totale_casi'
{
    "errors":[],
    "img":"iVBORw0KGgoAA...",
    "status":"ok"
}curl --request GET \
--url 'https://www.covidash.it/api/plot?data_type=national&varname=totale_casi&download=true' \
--output plot.pngThe plot will be saved in ./plot.png
If you liked this project or if I saved you some time, feel free to buy me a beer. Cheers!