5. Netlogo code anatomy
This document provides a detailed information of my codes from the pollution exposure ABM. The purpose is to help people understand how the codes work for this simulation. Another intention is to receive feedbacks and comments from the readers. But first of all, please enjoy running my model!
As all NetLogo models do, it begins by creating a global tab that comprises extensions, globals, breed, patches-own, and people-own. Netlogo has embedded csv and table extensions, so by typing them would load them automatically.
For global variables, districtPop and districtadminCode was added to create population groups and area codes. %riskpop is a percentage of people whose health are under 100, pollution is the value of PM10 imported from a GIS raster file, date and where are dates and location to distinguish office and home hours, number-dead is for agents whose health are under zero.
patches-own has 6 attributes. gangnam is defined to distinct boundaries from Gangnam to others, dong divides boundaries between sub-districts, land is an aggregation of land price per sub-district in 2010, road is roads in Gangnam, locationName is a sub-district name, and current_pollution is the current PM10 value of a patch.
people-own has 10 attributes. health is an agent's health where all agents start with 300. age varies from 5 to 95. edu is scaled from 1 to 7, low to high. districtName and homeName equally indicate sub-districts, district-code is an area number of a sub-district, and homePatch is an agent's residential location. destinationName and destinationPatch are agent's destined place. Finally, age-counter is a random number between 1 and 730, assuming birthdays vary across agents. The age-counter counts backwards. When it reaches zero, an individual will grow a year older and the counter will soon reset back to 730 and does the same process.
extensions [table csv]
globals [districtPop districtadminCode %riskpop pollution date where number-dead]
breed[people person]
patches-own [gangnam dong land road locationName current_pollution ]
people-own  [health age edu districtName district-code
homeName homePatch destinationName destinationPatch age-counter]This is the setup and go process. Mainly, it imports files and creates people and their destinations, and move outside and come back home. Each individual will be exposed to PM10 when it breaches Korean national hourly limit of 100 μg/m3. The entire process will end when the ticks reach 4382 (31st of December, 2015), or more than half of the population are at risk.
to setup
  clear-all
  reset-ticks
  setup-gis
  set-dictionaries
  set-people
  set-destination
end

to go
  calc-pm10
  landprice-change
  move-people
  inhalation
  ask people [
    adaptive-cap
    sensitivity
    road-effect
    add-age
    ]

  gu-plot
  dong-plot
  age-plot
  edu-plot
  pm10-plot
  update-plots
  tick
  set %riskpop (count people with [color = red and destinationName != "others"] /
                count people with [destinationName != "others"]) * 100
  set number-dead count people with [health < 0]
  set date  item 0 table:get pollution ticks
  set where item 1 table:get pollution ticks
if ticks = 4382 or %riskpop >= 50 [stop]Several GIS files were imported in the NetLogo environment, where each variable was exported in a text format from a 30m resolution raster image. Since this project was conducted without an extensions [gis], these text files had to be edited as a list format. For this reason, each file header was removed, then the square brackets were inserted before and after the first and last value. Interpolated PM10 concentration,admin boundaries, 2010 land price, and main roads of Gangnam were imported.
Note that ArcMap sets -9999 as a null value, and from Netlogo 6 you will have a -> right arrow that commands you to run each item from the list.
  ;Kriging 2010-01-01 mean
  file-open "data/Gangnam_Kriging.txt"
  let pollution-K file-read
  file-close
  (foreach sort patches pollution-K [ [the-patch the-pollution] ->
    ask the-patch [ set current_pollution the-pollution ]
  ])

;--Gangnam Administrative Boundary
  file-open "data/Gangnam_admin.txt"
  let patch-admin file-read
  file-close
  (foreach sort patches patch-admin [ [the-patch the-admin] ->
    ask the-patch [ set dong the-admin]
  ])
  let max-a max [dong] of patches
  let min-a min [dong] of patches with [dong > -9999]
  ask patches with [dong > -9999]
    [ set pcolor scale-color blue dong min-a max-a]

 ;--Gangnam Land Price
  file-open "data/Gangnam_land.txt"
  let patch-land file-read
  file-close
  (foreach sort patches patch-land [ [the-patch the-land] ->
    ask the-patch [ set land the-land]
  ])

 ;--Gangnam (Main)Roads
  file-open "data/Gangnam_road.txt"
  let patch-road file-read
  file-close
  (foreach sort patches patch-road [ [the-patch the-road] ->
    ask the-patch [ set road the-road]
  ])
   ask patches with [road >= 60][set pcolor yellow + 2 set road true set current_pollution
    (current_pollution + current_pollution * 0.426)]  ;; added 42.6% increase to road pollution
   ask patches with [road = -9999][set road false]

 ;-- Set territory
ask patches [ ifelse dong = -9999 [set gangnam false][set gangnam true]]
Having compared pollution levels between background and roadside, the overall ratio was 1:1.426. Thus, an extra 42.6% of background level concentration was added to road patches.
To implement a particle change over the study period, a half day PM10 from the Gangnam background station was imported in a .csv file. The data provided by Seoul Institute were cleaned as below:
no	date	        type	place	mean	sd	min	25%	50%	75%	max	diff
1	2010.1.1	pm10	home	37.077	6.396	28	33	36	39	52	0
2	2010.1.1	pm10	work	35.727	3.69	29	34	36	37	41	-1.35
3	2010.1.2	pm10	home	56.231	22.775	37	39	41	77	99	20.504
4	2010.1.2	pm10	work	55.182	19.24	39	43	47	61.5	102	-1.049
Using the csv extension, p0 imports a csv file named data/Gangnam_daily-pollution-stats.csv. pm10 is a raw data without column headers. pollution is a list based on a table extension. The authors found table structure as "NetLogo friendly". By saying NetLogo friendly means that the coder can browse a certain row by just typing the row name (see Here for further information).
  ;Import daily pollution
  let p0 csv:from-file "data/Gangnam_daily-pollution-stats.csv"
  let pm10 remove-item 0 p0  ;;remove headers in the csv file
  let rep 0  ;; loop
  set pollution table:make
For each row, column no was assigned as a key indicator, followed by date,place, mean pm10, standard deviation, min value, max value, and diff. diff is a difference from the mean value in the current row to the row above (e.g. B2 - A2).
list concatenates two strings to a list format, but once the list is created, adding new atomic vectors becomes unavailable. However, the lput function solves this problem.
  foreach pm10 [poll ->
    let counter item 0 poll ;; counter
    let date/place list( item 1 poll) (item 3 poll) ;; add date and place
    let meanPm10 lput item 4 poll date/place  ;; add mean PM10
    let SD lput item 5 poll meanPm10
    let diff lput item 11 poll SD ;; add difference from previous meanPM10
    let pmMin lput item 6 poll diff
    let pmMax lput item 10 poll pmMin
    table:put pollution counter pmMax
  ]
set rep rep + 1This project used an 1% sample from the census statistics for the sake of simulation speed. census2010_age.csv has 6 variables: code, gu, subdis(name), under 15, btw15-64, and over65.
code	gu	subdis	   under15   btw15-64	over65
1121052	gwanak	boramae	   22	     195	26
1121054	gwanak	chnim	   17	     120	16
1121057	gwanak	hengun	   17	     235	25
1121058	gwanak	nak	   12	     179	13
...
...
...
1123051	gangnam	sinsa	   16	     143	20
1123052	gangnam	nonhyun1   10	     213	16
1123053 gangnam nonhyun2 14 182 17This code block was to name district names for each patches. Since the admin patch only had district codes, it needed to be merged through the census file. For each rawCode, the rows were selected by its district name Gangnam, then its district and sub-district name were sent to the adCode table. After adCode contained admin codes and names, it asks patches to correspond admin codes and clone their location names ask patches [if dong = adminCODE [set locationName x]]. Now, each patch has a location name in its attribute table.
 ;-- Set Location Name
  let rawCode csv:from-file "data/census2010_age.csv"
  let adCode table:make
  foreach rawCode [ code ->
         if item 1 code = "gangnam"
        [table:put adCode item 0 code list (item 1 code)(item 2 code) ]
        ]
  foreach table:keys adCode [ adminCODE ->
       let loops 0
       foreach table:get adCode adminCODE [ x ->
           ask patches [if dong = adminCODE [set locationName x]]
            ]
       set loops loops + 1
]set-dictionaries mean to allocate agent's district, with its home name and code. Precisely, there are two lists to be made: 1) districtpop for district names and population groups, 2) districtadminCode for district names and location codes. With the census2010_age.csv file (please refer to the data in the beginning of this section), districtpop now has a district name and population by age groups, and districtadminCode has district name and code.
to set-dictionaries
  let csv-age csv:from-file "data/census2010_age.csv"
  set districtpop table:make
  set districtadminCode table:make

  foreach csv-age [ code ->
  if item 1 code = "gangnam"
    [let twogroups list (item 3 code) (item 4 code)
     let threeAgegroups lput item 5 code twogroups
     table:put districtpop item 2 code threeAgegroups
     table:put districtadminCode item 2 code item 0 code
    ]
  ]
Here is the result:
observer> show districtPop
observer: {{table: [["sinsa" [16 143 20]] ["nonhyun1" [10 213 16]] ["nonhyun2" [14 182 17]] ["samsung1" [12 115 12]] ["samsung2" [30 235 20]] ["daechi1" [40 182 15]] ["daechi4" [15 179 12]] ["yeoksam1" [12 294 19]] ["yeoksam2" [33 255 21]] ["dogok1" [20 158 15]] ["dogok2" [39 230 24]] ["gaepo1" [22 171 17]] ["gaepo4" [26 177 14]] ["ilwon" [28 168 14]] ["ilwon1" [16 138 17]] ["ilwon2" [20 143 15]] ["suseo" [8 130 24]] ["segok" [3 30 6]] ["ap" [28 188 31]] ["chungdam" [28 215 23]] ["daechi2" [48 327 25]] ["gaepo2" [38 274 20]]]}}
observer> show districtadminCode
observer: {{table: [["sinsa" 1123051] ["nonhyun1" 1123052] ["nonhyun2" 1123053] ["samsung1" 1123058] ["samsung2" 1123059] ["daechi1" 1123060] ["daechi4" 1123063] ["yeoksam1" 1123064] ["yeoksam2" 1123065] ["dogok1" 1123066] ["dogok2" 1123067] ["gaepo1" 1123068] ["gaepo4" 1123071] ["ilwon" 1123072] ["ilwon1" 1123073] ["ilwon2" 1123074] ["suseo" 1123075] ["segok" 1123076] ["ap" 1123077] ["chungdam" 1123078] ["daechi2" 1123079] ["gaepo2" 1123080]]}}Blimey, This part is tricky to understand! But it is very easy. In the second row, it means that for each name of district dist, loop all the code below based on age groups. Agents aged under 15 are coloured in orange, between 15 and 64 in turquoise, and brown for over 65. The residents in each sub-district will easily find their home district and patch. Since their destination is unknown yet, it is left as unidentified.
to set-people
  foreach table:keys districtpop [ dist ->
    let ageGroupID 0
    foreach table:get districtpop dist [ number ->
      create-people number [
        setupAgeGroup agegroupID
        set districtName dist
        set district-code table:get districtadminCode dist
        set shape "person"
        set heading random 360
        set homeName dist
        set homePatch one-of patches with [dong = [district-code] of myself ]
        move-to homePatch
        set destinationName "unidentified"
        set destinationPatch "unidentified"
        set health 300
      ]
      set ageGroupID AgeGroupID + 1
      ]
  ]
end

to setupAgeGroup [ID]
  if ID = 0 [set size 1 set age 10 + random 5  set edu 2 + random 2 set color orange]
  if ID = 1 [set size 1 set age 15 + random 50 set edu 5 - random 2 set color turquoise]
  if ID = 2 [set size 1 set age 65 + random 30 set edu 2 + random 4 set color brown]
endHere is a captured file of Gangnam's origin-destination matrix (imported from KTDB 2014, Korea Transportation Database). Gangnam has 22 sub-districts, or dongs, so it has 22 origins indicated in the first column. The original data were reported from counts, but were converted to fractions for convenience. Commuters travelling beyond Gangnam, assigned as others, account for more than a half of the population. For this research, however, agents who commute within the district are taken into consideration.
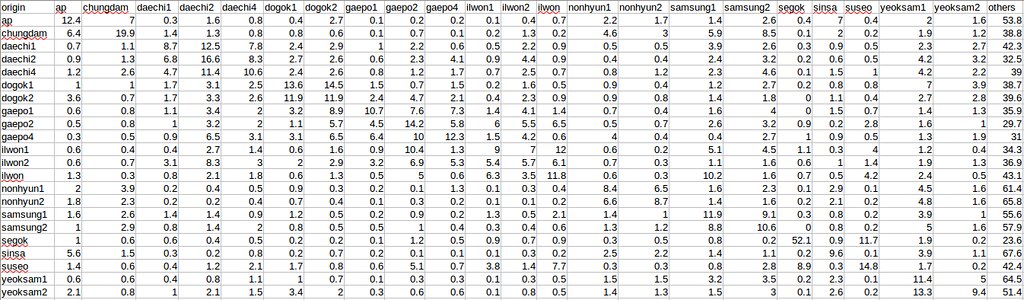
To set each agent's destination, Gangnam's origin-destination matrix was imported as gncsv. destinationNames excluded the first column that listed the origin districts. gnMat is a list of origins with fractions to each destination. gnMatrix is a plain array with nothing at the moment, but each origins("keys") will be defined. Loops will iterate from the first district ap until it reaches the last district `yeoksam2'.
to set-destination
  let gncsv csv:from-file "data/Gangnam_odmatrix.csv"
  let rawheader item 0 gncsv
  let destinationNames remove-item 0 rawheader
  let gnMat remove-item 0 gncsv
  let loopnum 1
  let gnMatrix table:make

  foreach gnMat [ origin-chart ->
    let numberMat remove-item 0 origin-chart    ;; fraction has to be btw 0-1,
    let fraction map [ i -> i / 100 ] numberMat ;; but the original file is btw 1-100
    table:put gnMatrix item 0 origin-chart fraction
                 ]
  set loopnum loopnum + 1
Once gnMatrix was created, I assigned matrix-loop as to iterate counters through districts, Num as to count people whose home name equals to origin name and are 15-64 of age, totalUsed as to sum up the running total of agents allocated, and number as a final allotment of agents after rounding the decimal points.
Each origin needs a newDestination. But it needs to be extremely careful when setting conditions. I set two conditions: 1) if agents move within Gangnam, count agents by rounding the values of population aged 15-64 with "fraction of region A", then count the population with "fraction of region B".. and so on; 2) if agents move outside Gangnam, count the remainder of the population not used for inbound population.
As a result, agents will have a new destination name and patch.
  foreach table:keys gnMatrix [ originName ->
    let matrix-loop 0
    let Num count people with [homeName = originName and (age >= 15 and age < 65)
    let totalUsed 0
    let number 0

  foreach table:get gnMatrix originName
       [ percent ->
          let newDestination item matrix-loop destinationNames
          ifelse (newDestination != "others")
              [set number round(percent * Num)
               set totalUsed totalUsed + number]
              [set number Num - totalUsed]

          ask n-of (number) (people with [homeName = originName and
                             destinationName = "unidentified" and (age >= 15 and age < 65)])
              [set destinationName newDestination ;; assign destination name
               set destinationPatch one-of patches with [locationName = newDestination]
       ]
    set matrix-loop matrix-loop + 1
  ]
What about the other age groups? What can we do to the inter-district commuters? I assumed that both the elderly and the young will not move to a distant place, thus asked them to walk to a random patch with a certain restriction. People commuting to another district was sent to a specific spot `max-pxcor max-pycor' during office hours.
;; Send agents selected as "others" to the NE corner
 ask people with [destinationpatch = "unidentified" and age <  15]
                 [set destinationPatch one-of patches in-radius 3] ;; Under 15
 ask people with [destinationpatch = "unidentified" and age >= 65]
                 [set destinationPatch one-of patches in-radius 1] ;; Over 65
 ask people [ if destinationName = "others"
             [ set destinationPatch patch max-pxcor max-pycor]
]In contrast with the setup process, go is relatively simple. The whole go process consists of three targets: 1) agent's movement and exposure, 2) agent's health recovery, and 3) time-series of pollution.
For simplicity, this model only considers exposures in two different places, one during office hours, and the other when they are at home. mod is used for temporal settings. Say if ticks divided by 2 has remainders, then move out, otherwise come home.
For the move-out and come-home function, the codes are not difficult to understand. Why did we add if health < 0 [move-to patch min-pxcor min-pycor]? This was to send agents whose health are below 0 to a certain place after being exposed to high level of PM10.
to move-people
  ifelse ticks mod 2 = 0 [move-out][come-home]
end

to move-out
  ask people [if patch-here != destinationPatch [ move-to destinationPatch fd 1]
    if health < 0 [move-to patch min-pxcor min-pycor]
  ]
end

to come-home
  ask people [
    if patch-here != homePatch [move-to homePatch fd 1]
    if health < 0 [move-to patch min-pxcor min-pycor]
  ]
end