scr singleanalysis
The following steps are found in the code initscript.m, where if the stored information is found, then it is loaded. On the contrary, the information is calculated as shown below.
- Segmentation of both channels with
simpleClumpsSegmentation.m. This yields the clumps and for each frame. - Use of phagosight for the tracking of the RED channel.
- Create upgraded table
tablenetwith the information formhandles.nodeNetworkand the addition of the clump information associated to it
The following steps show the process of choosing one of the tracks from the RED channel, and how they translate to a following of the GREEN channel, along the non-overlapping tracks.
- Choose a track.
- Get all non-overlapping paths of the track. The function
getpathsperlabel.mcarries this task. - For each path
- Load a frame.
- If there is no previous information on the track, use the GREEN segmentation from step 2..
- If there is a segmentation from a previous frame. Update the current
unknown frame based on the developments in
shapeevolution-iterative.md,scr-iteravolution-vs-leaking.mdandscr-iterevol-areacontrol.md.
The previous workflow was run on all images from the dataset. Individual changes can be found on single tracks, as shown in the figure below.
The program is able to analyse each cell's shape changes in time. The frame updates in step 6., there are two possible ways the active contours parameters are used. One is a straightforward implementation of parameters that worked consistently during trials; the other is a more complex way that attempts to keep control over the area of the updated cell shapes.
Both experiments were run for all independent cells and a gif was generated
for both experiments.
This is explained in log files
shapeevolution-iterative.md and
scr-iteravolution-vs-leaking.md.
| Parameters | Value |
|---|---|
| Iterations | 50 |
| Smooth factor | 1.5 |
| Contraction bias | -0.1 |

This is thoroughly explained in log file
scr-iterevol-areacontrol.md. The
parameters used are dependant on the state of the updating cell: Grow,
Shrink or Normal.
| Parameters | Shrink | Grow | Normal |
|---|---|---|---|
| Iterations | 100 | 200 | 50 |
| Smooth factor | 1.25 | 1 | 1.5 |
| Contraction bias | 0.1 | -0.25 | -0.1 |
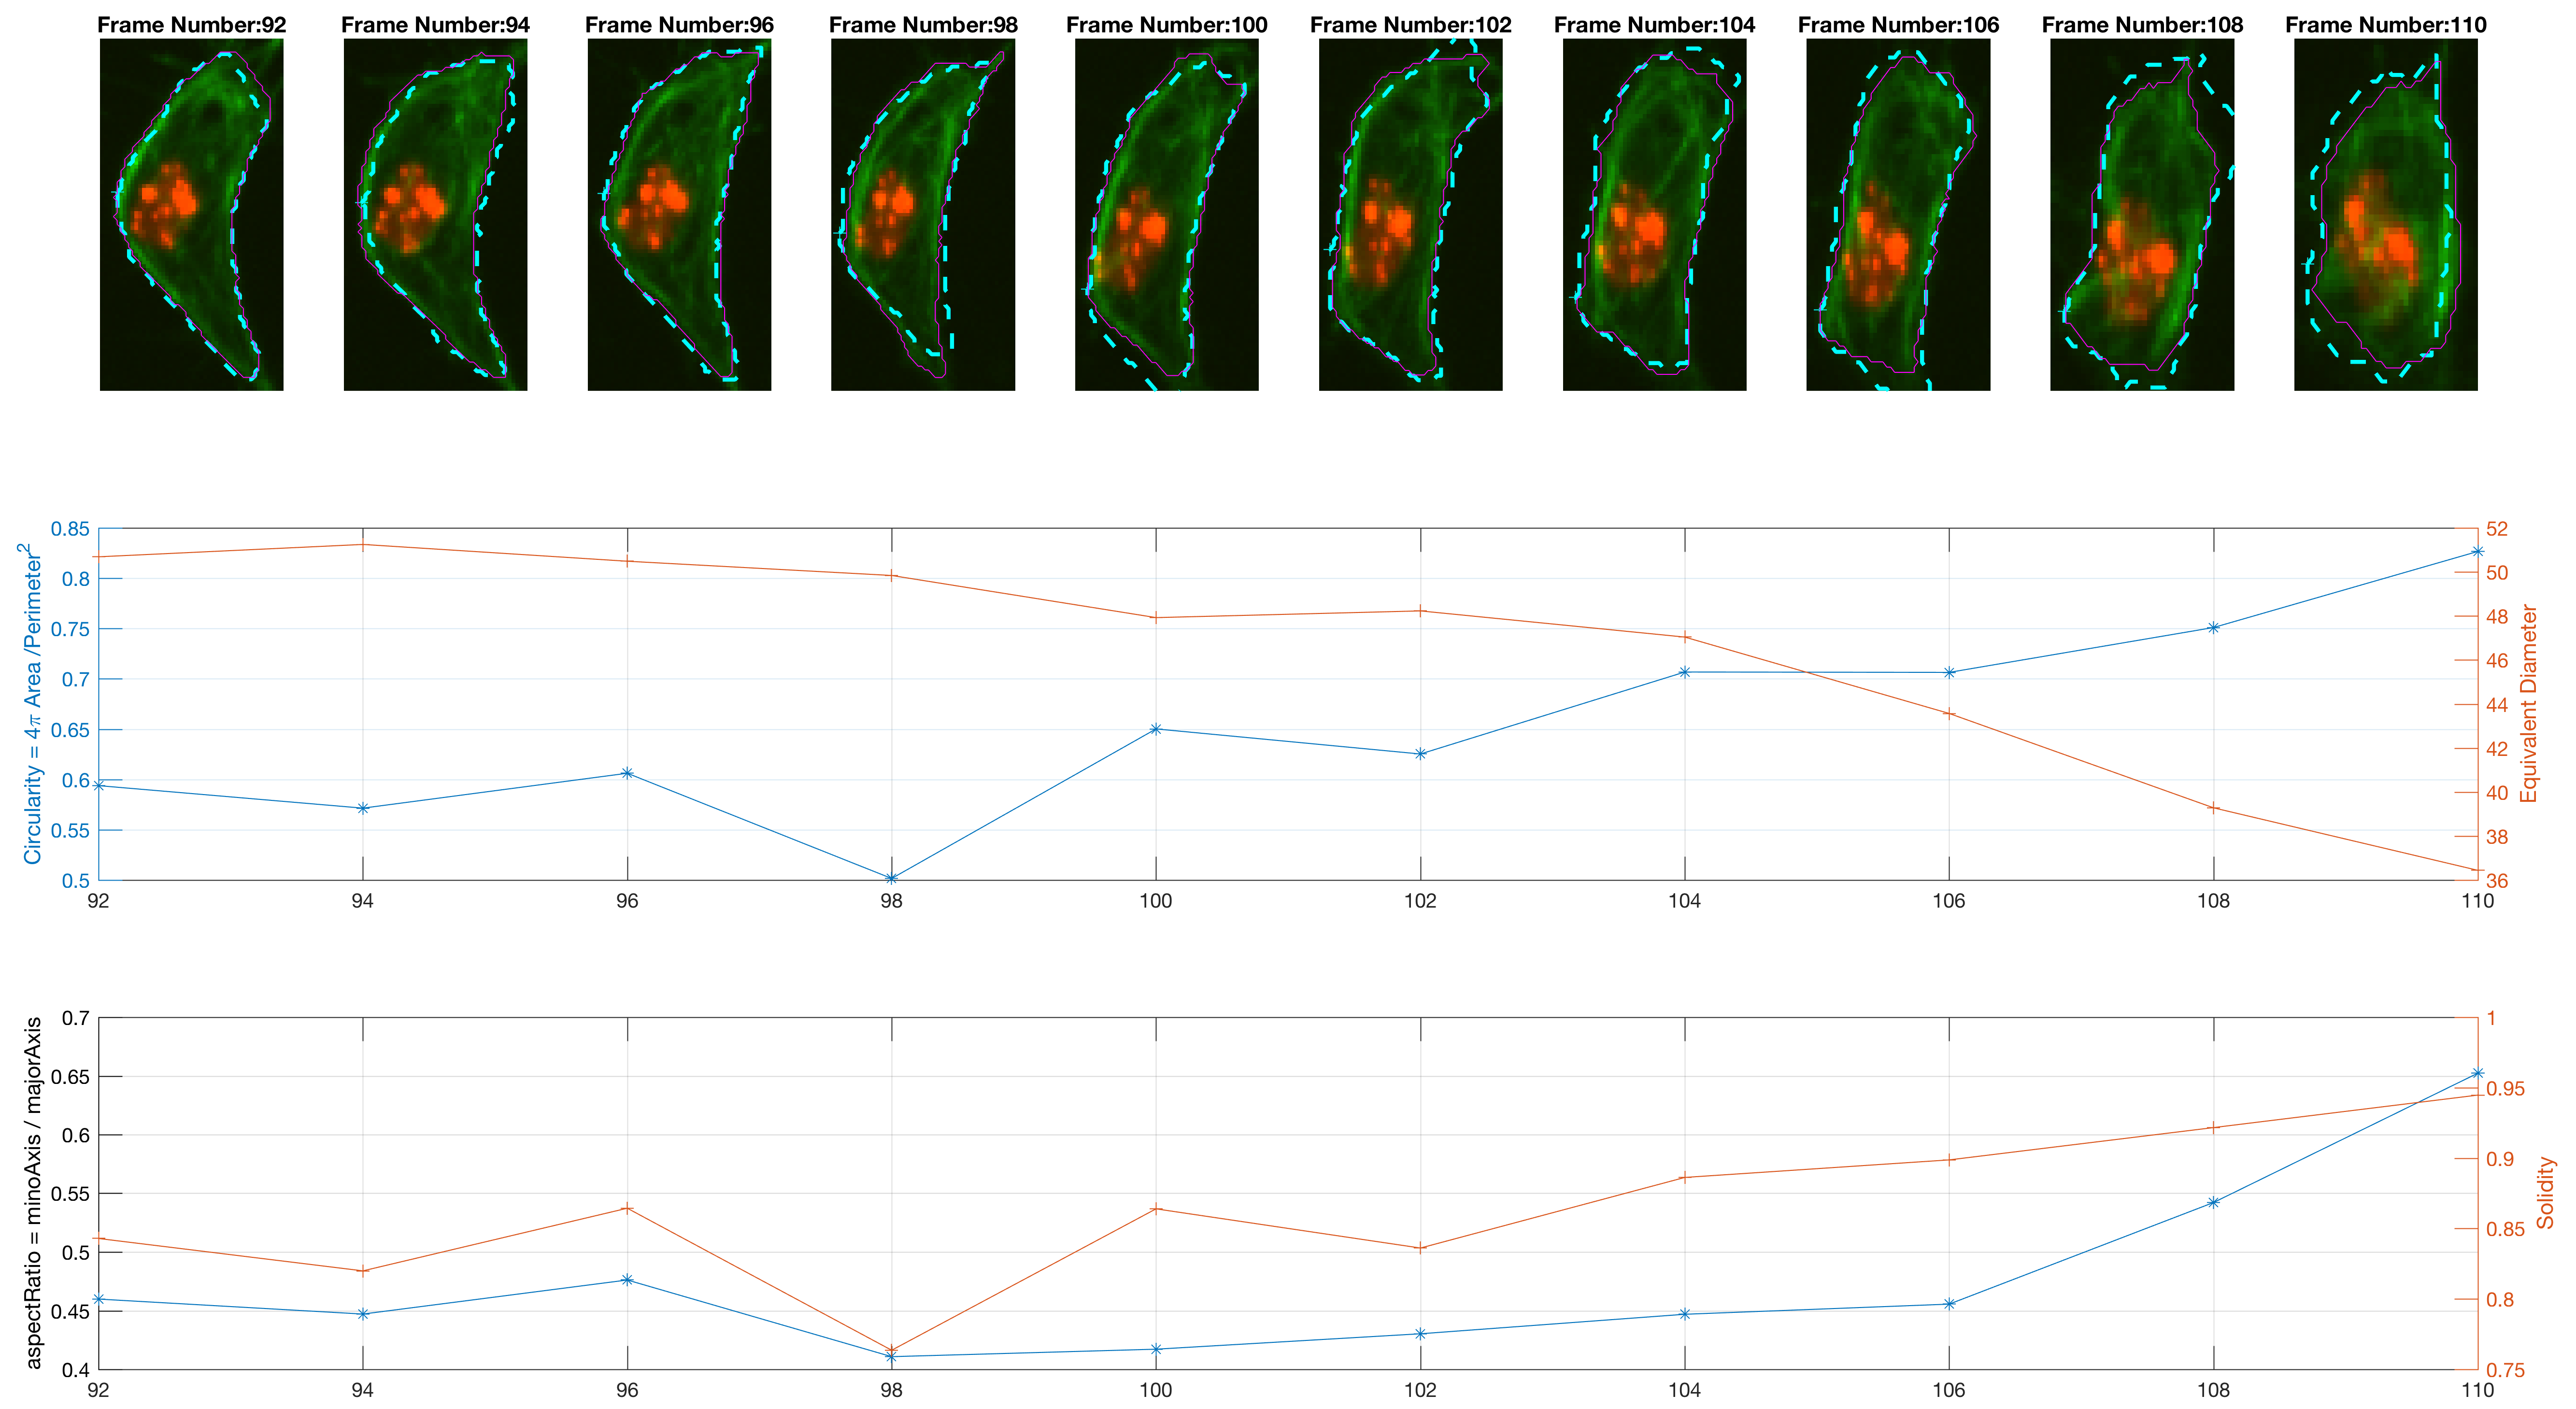
Traditionally,
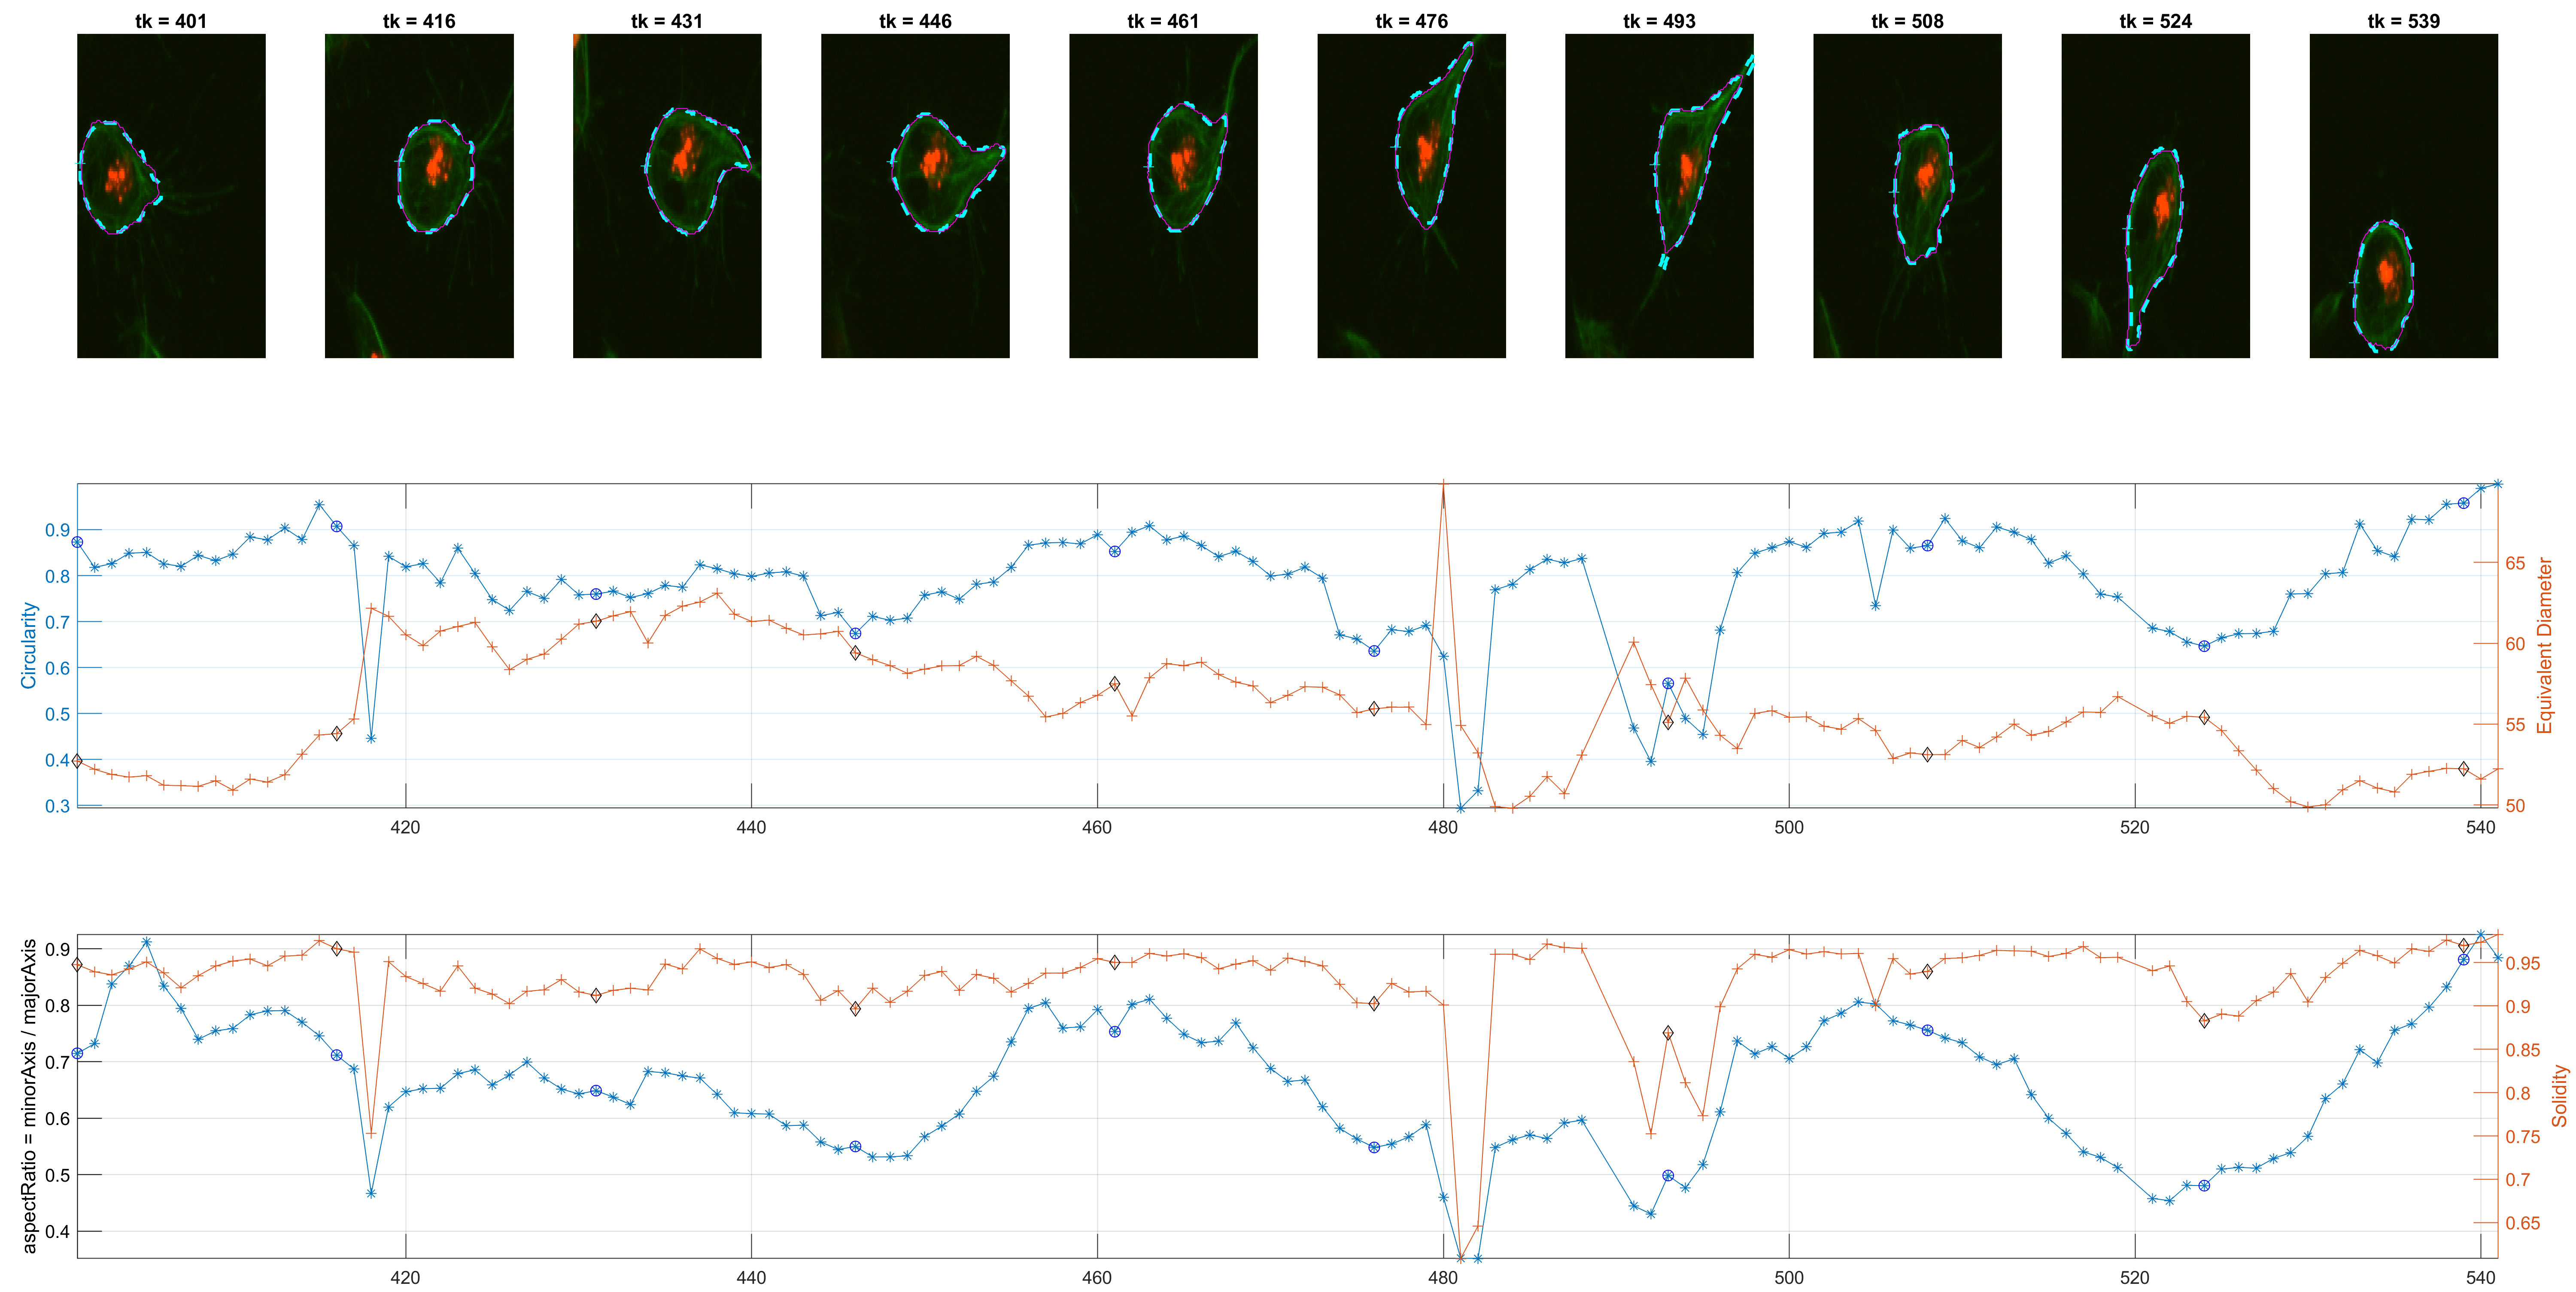
The measurement for circularity seemed noisy and non helpful. The Orientation was preferred, because it could lead to findings with the
Using the anglegram matrix, the shape can be analysed and find the corners. Synthetic data was used to test the corner detection. An example below:
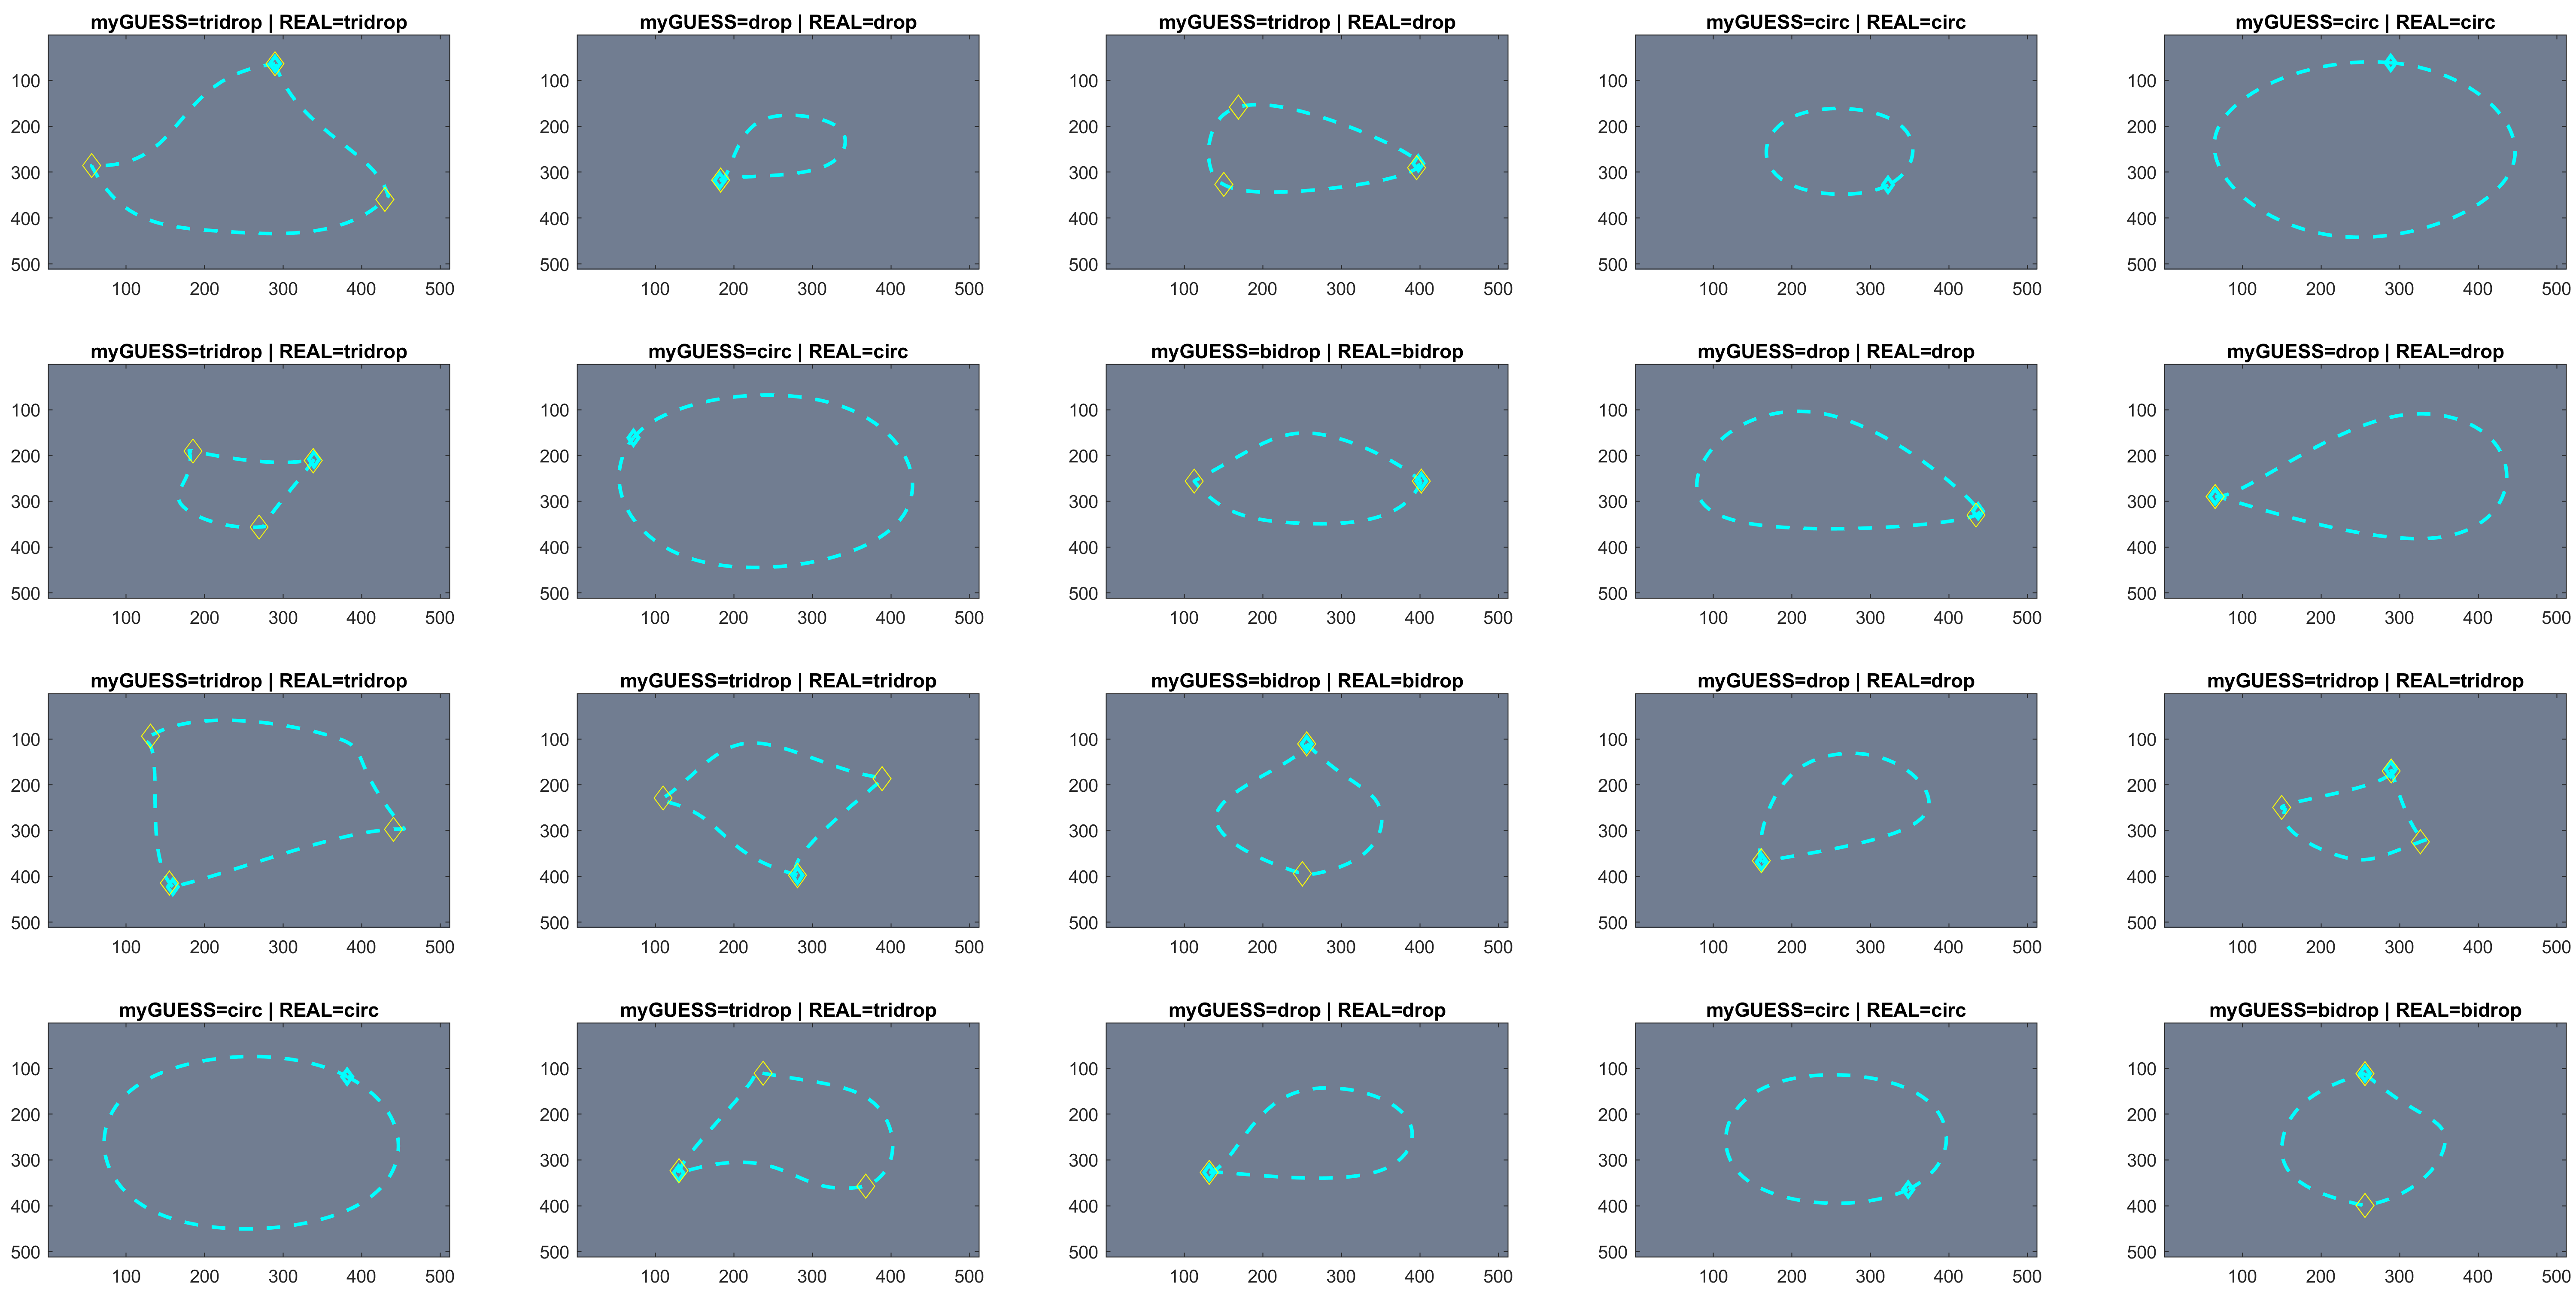
From the 700 test images, around 90% of the cases were correctly predicted.
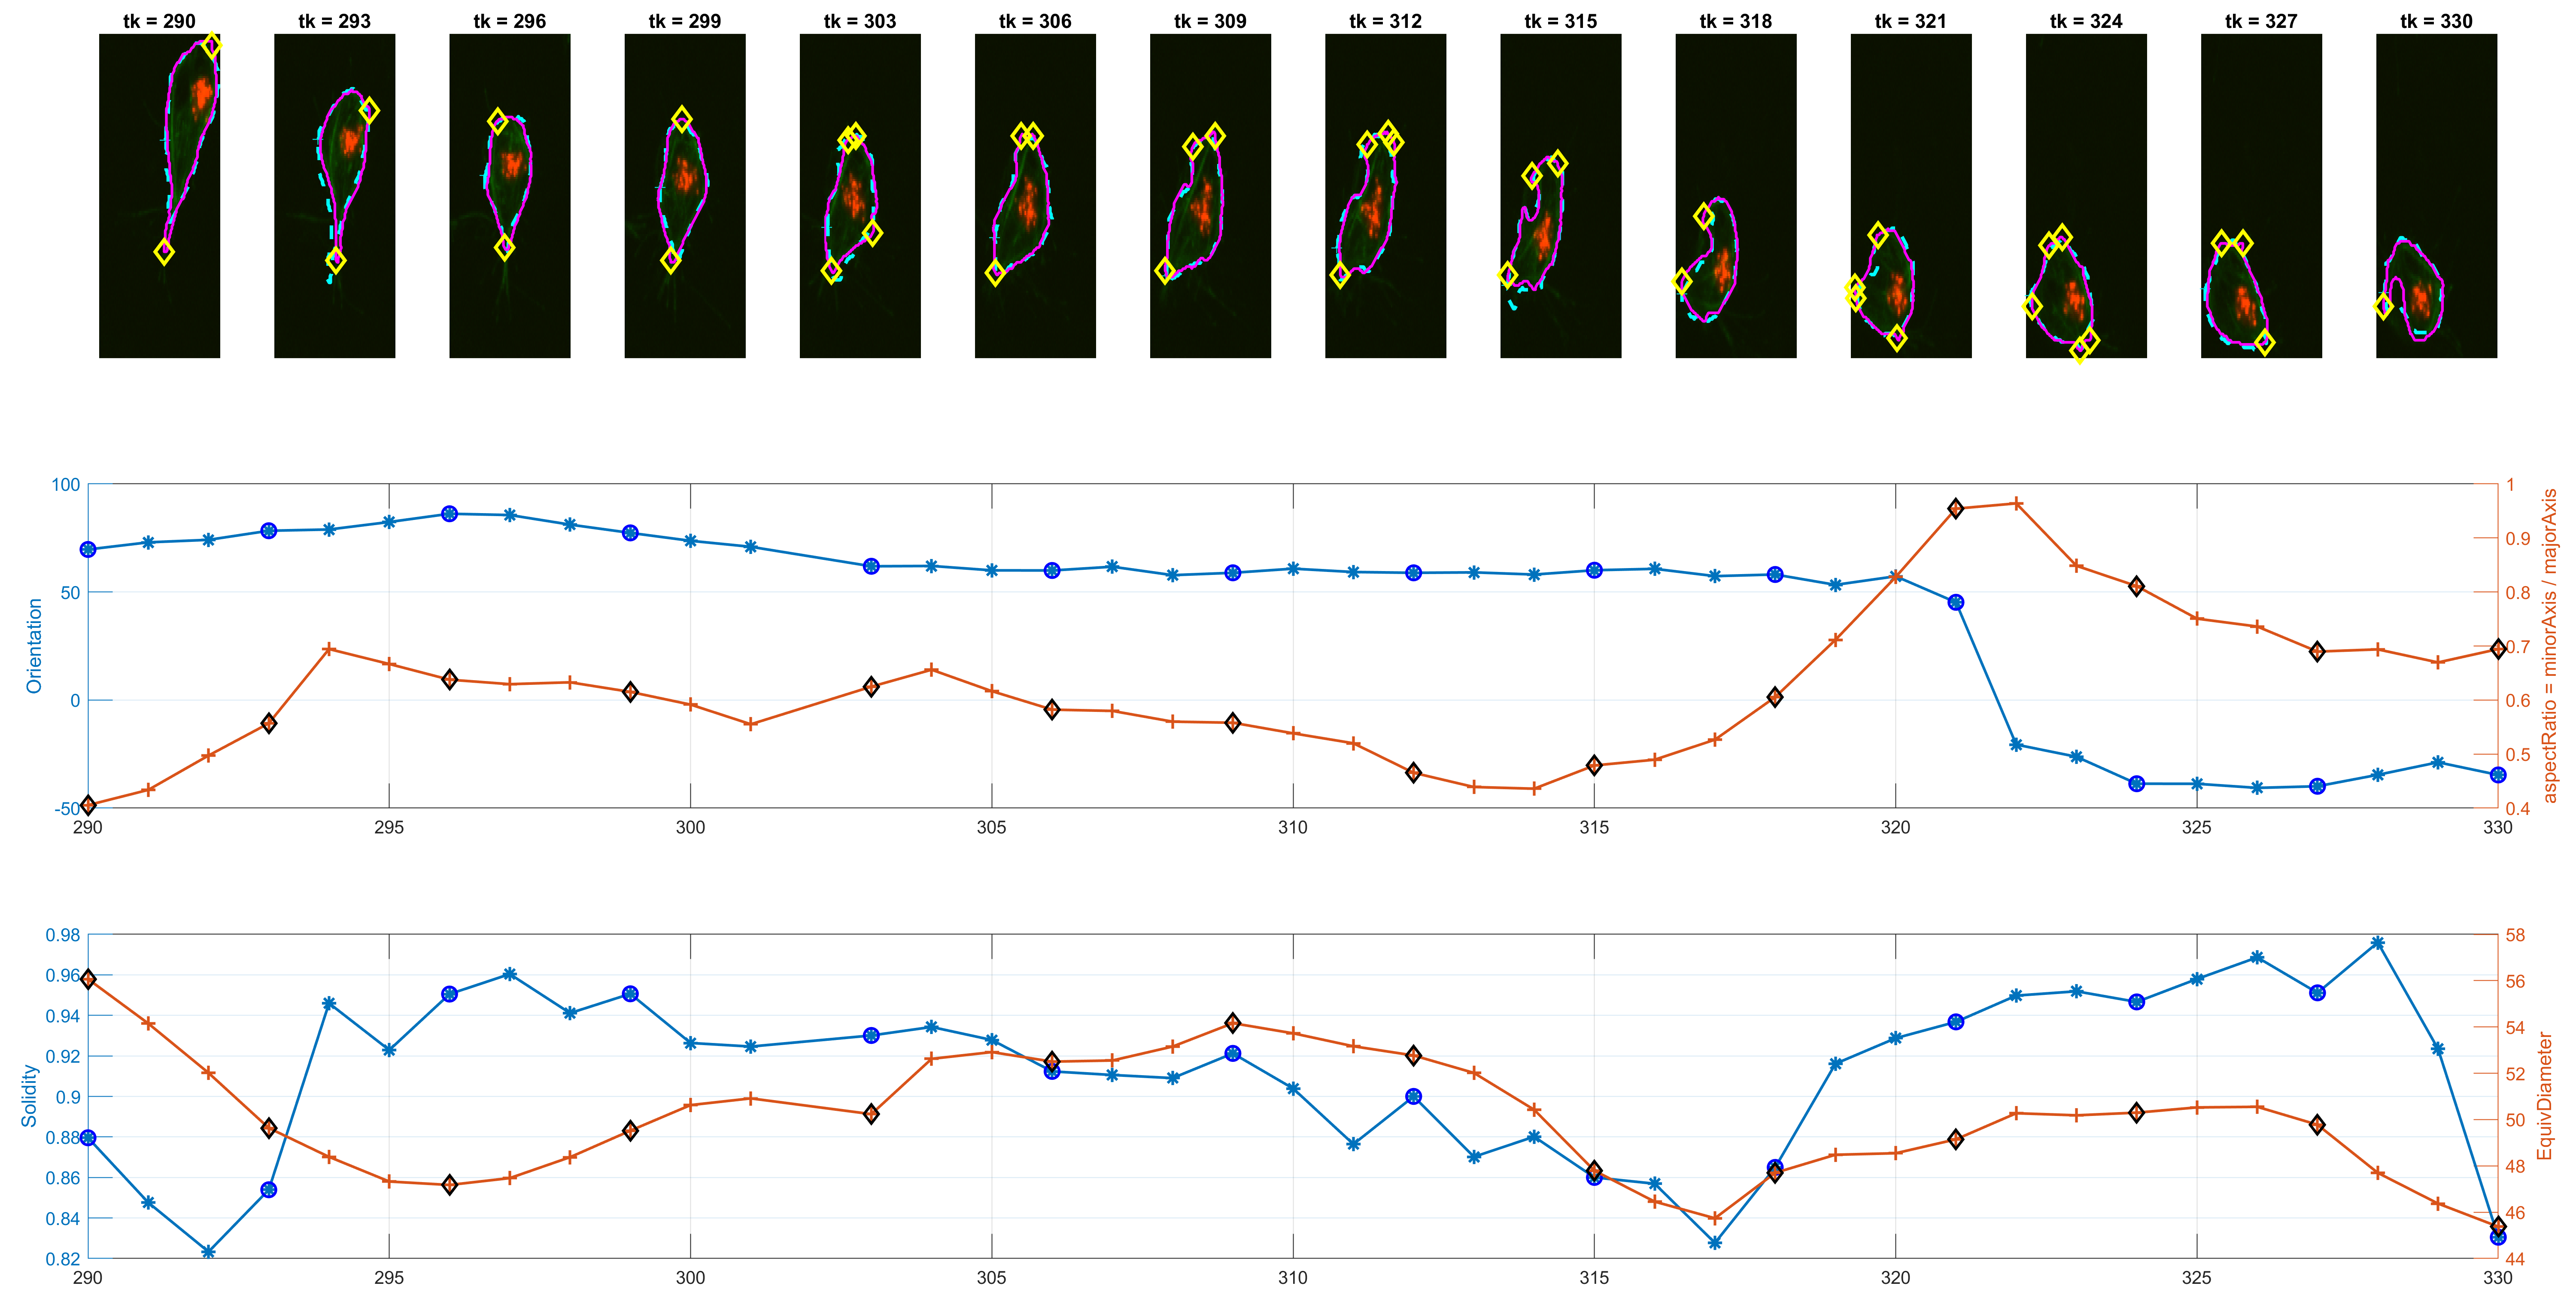
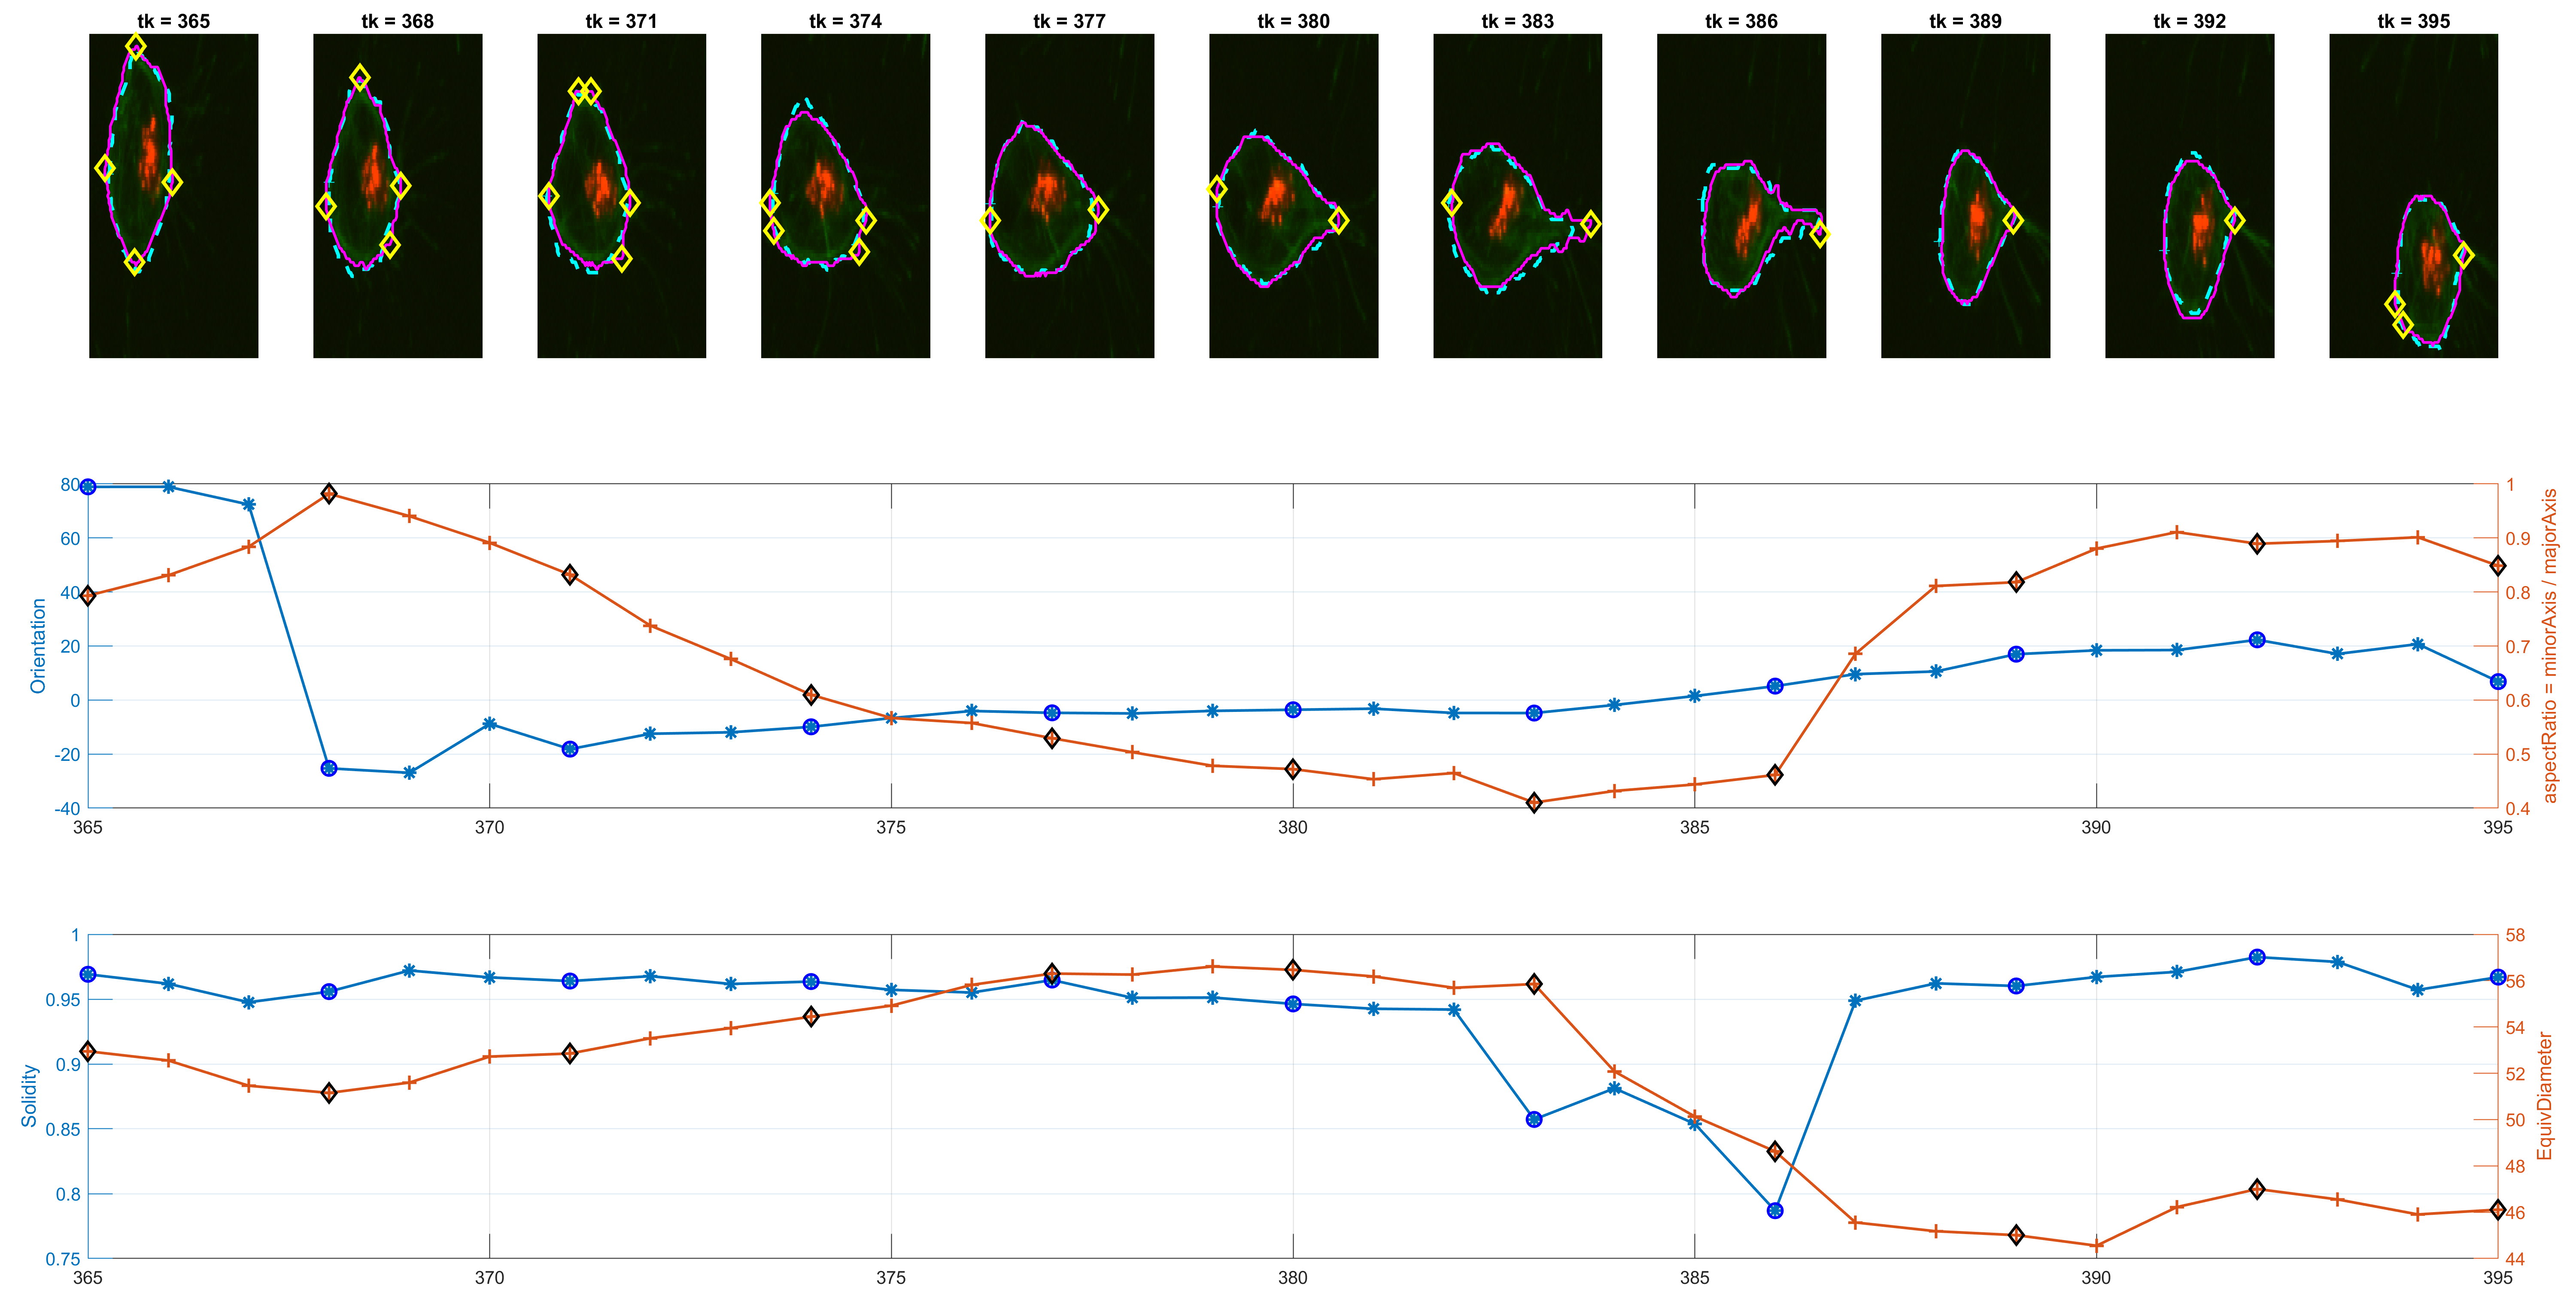
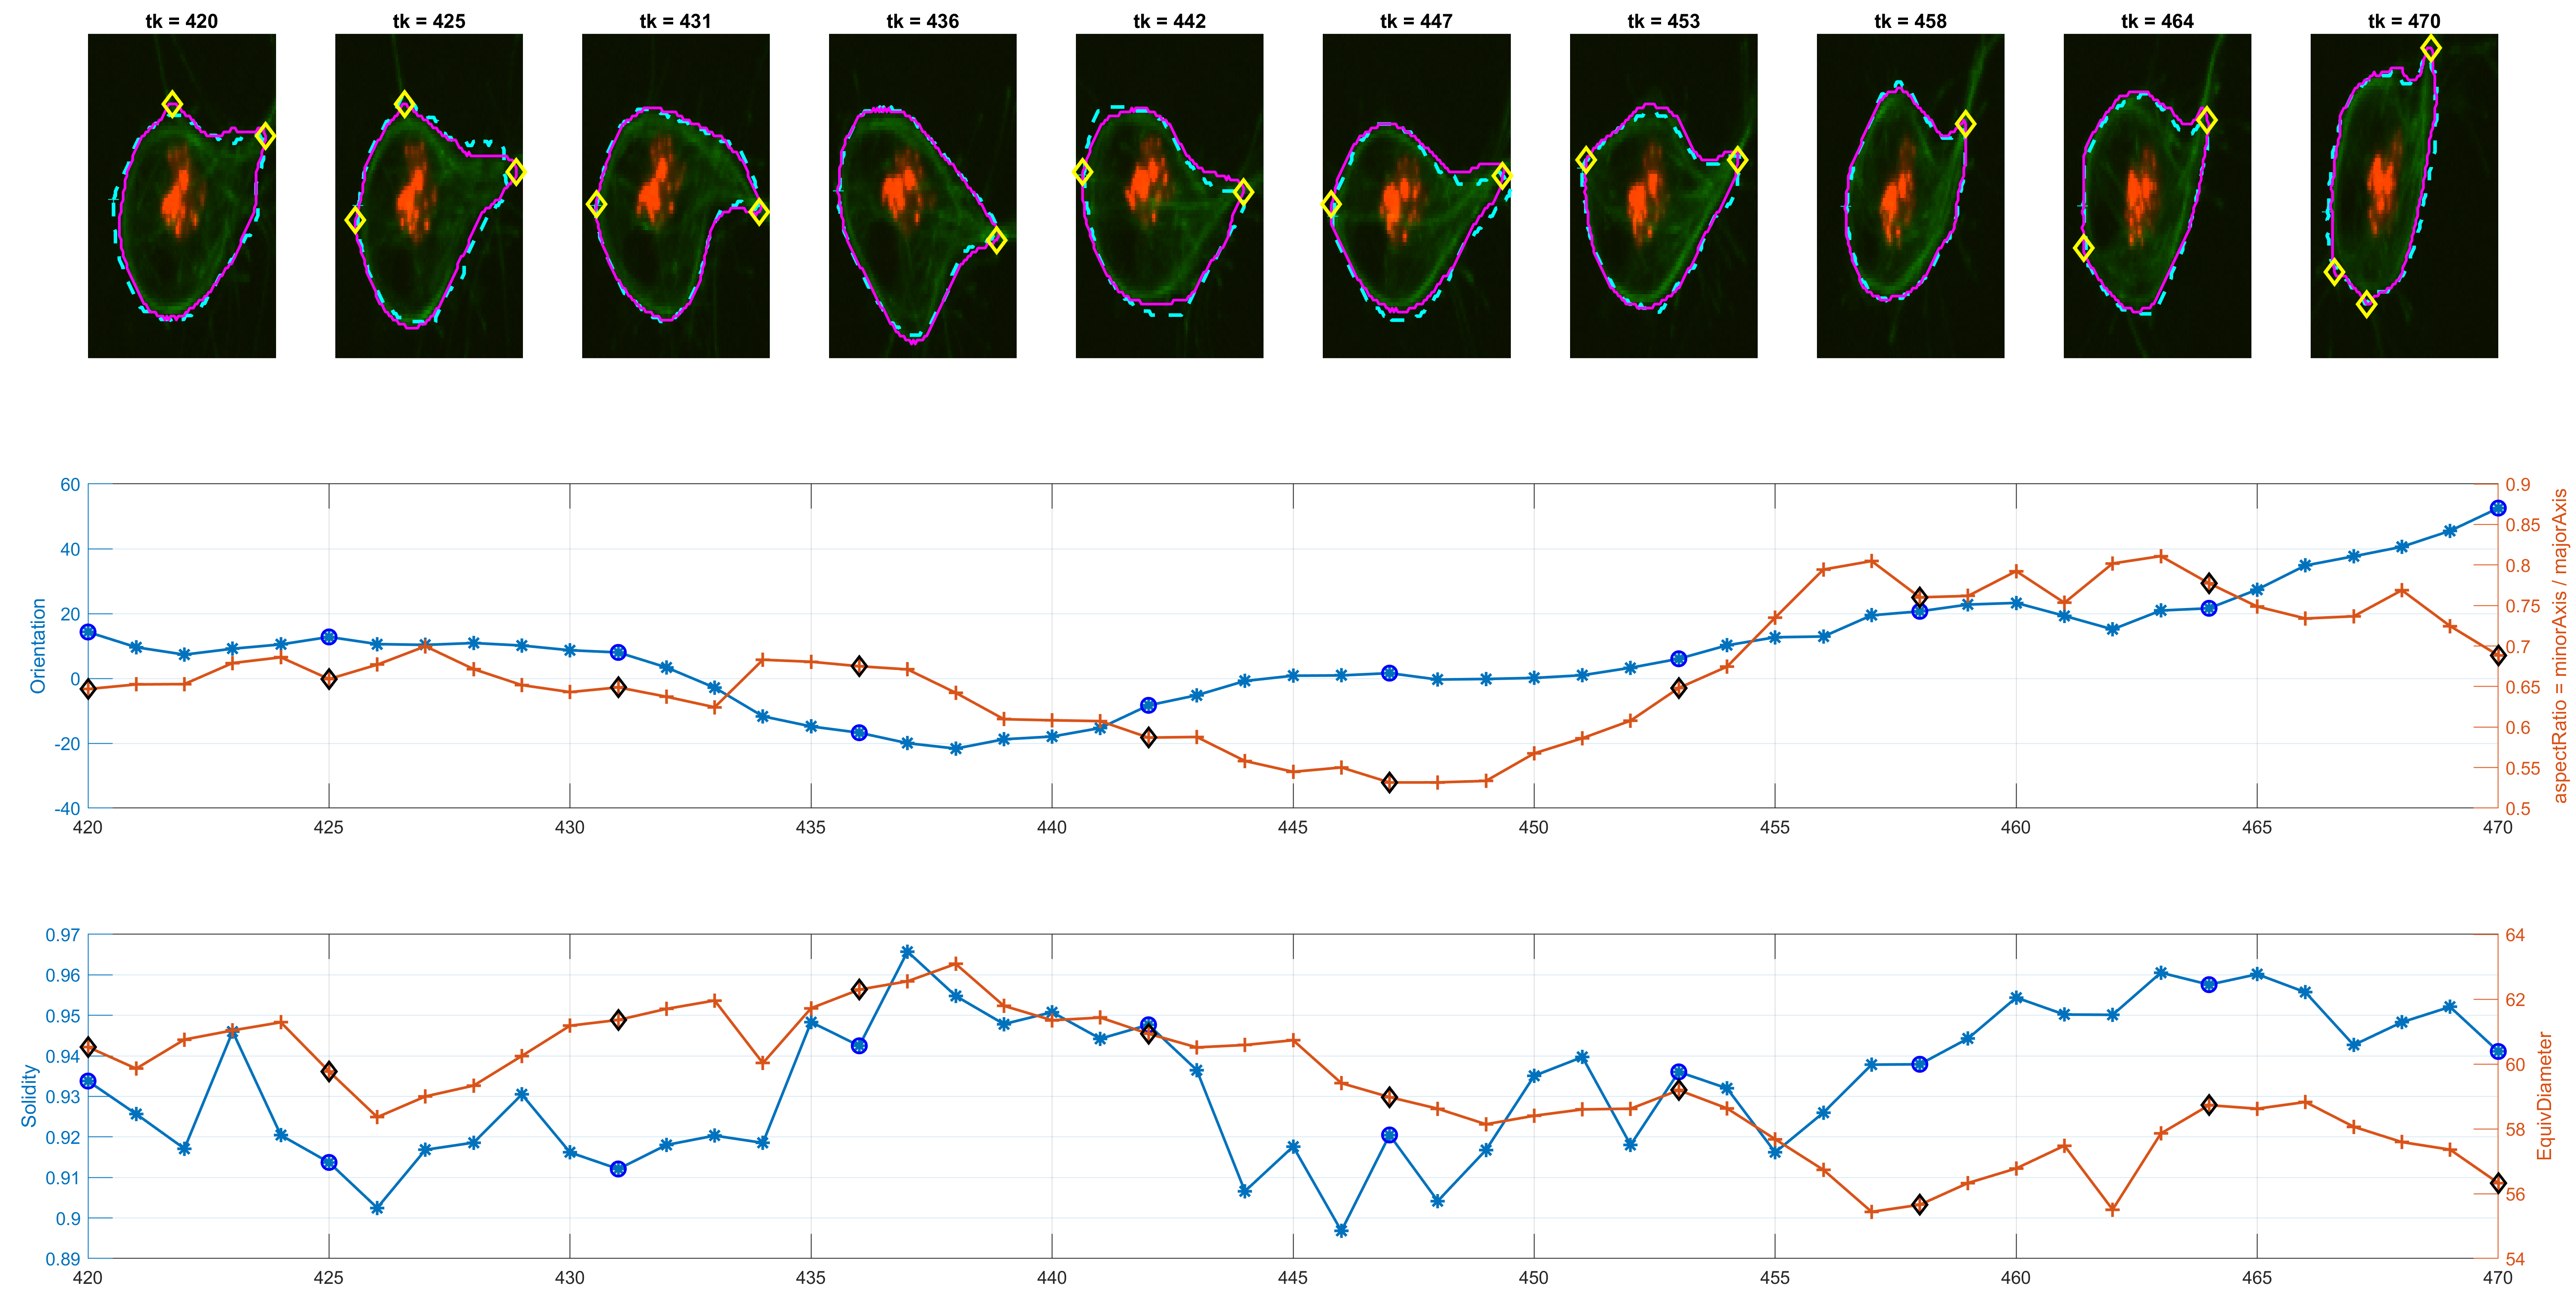
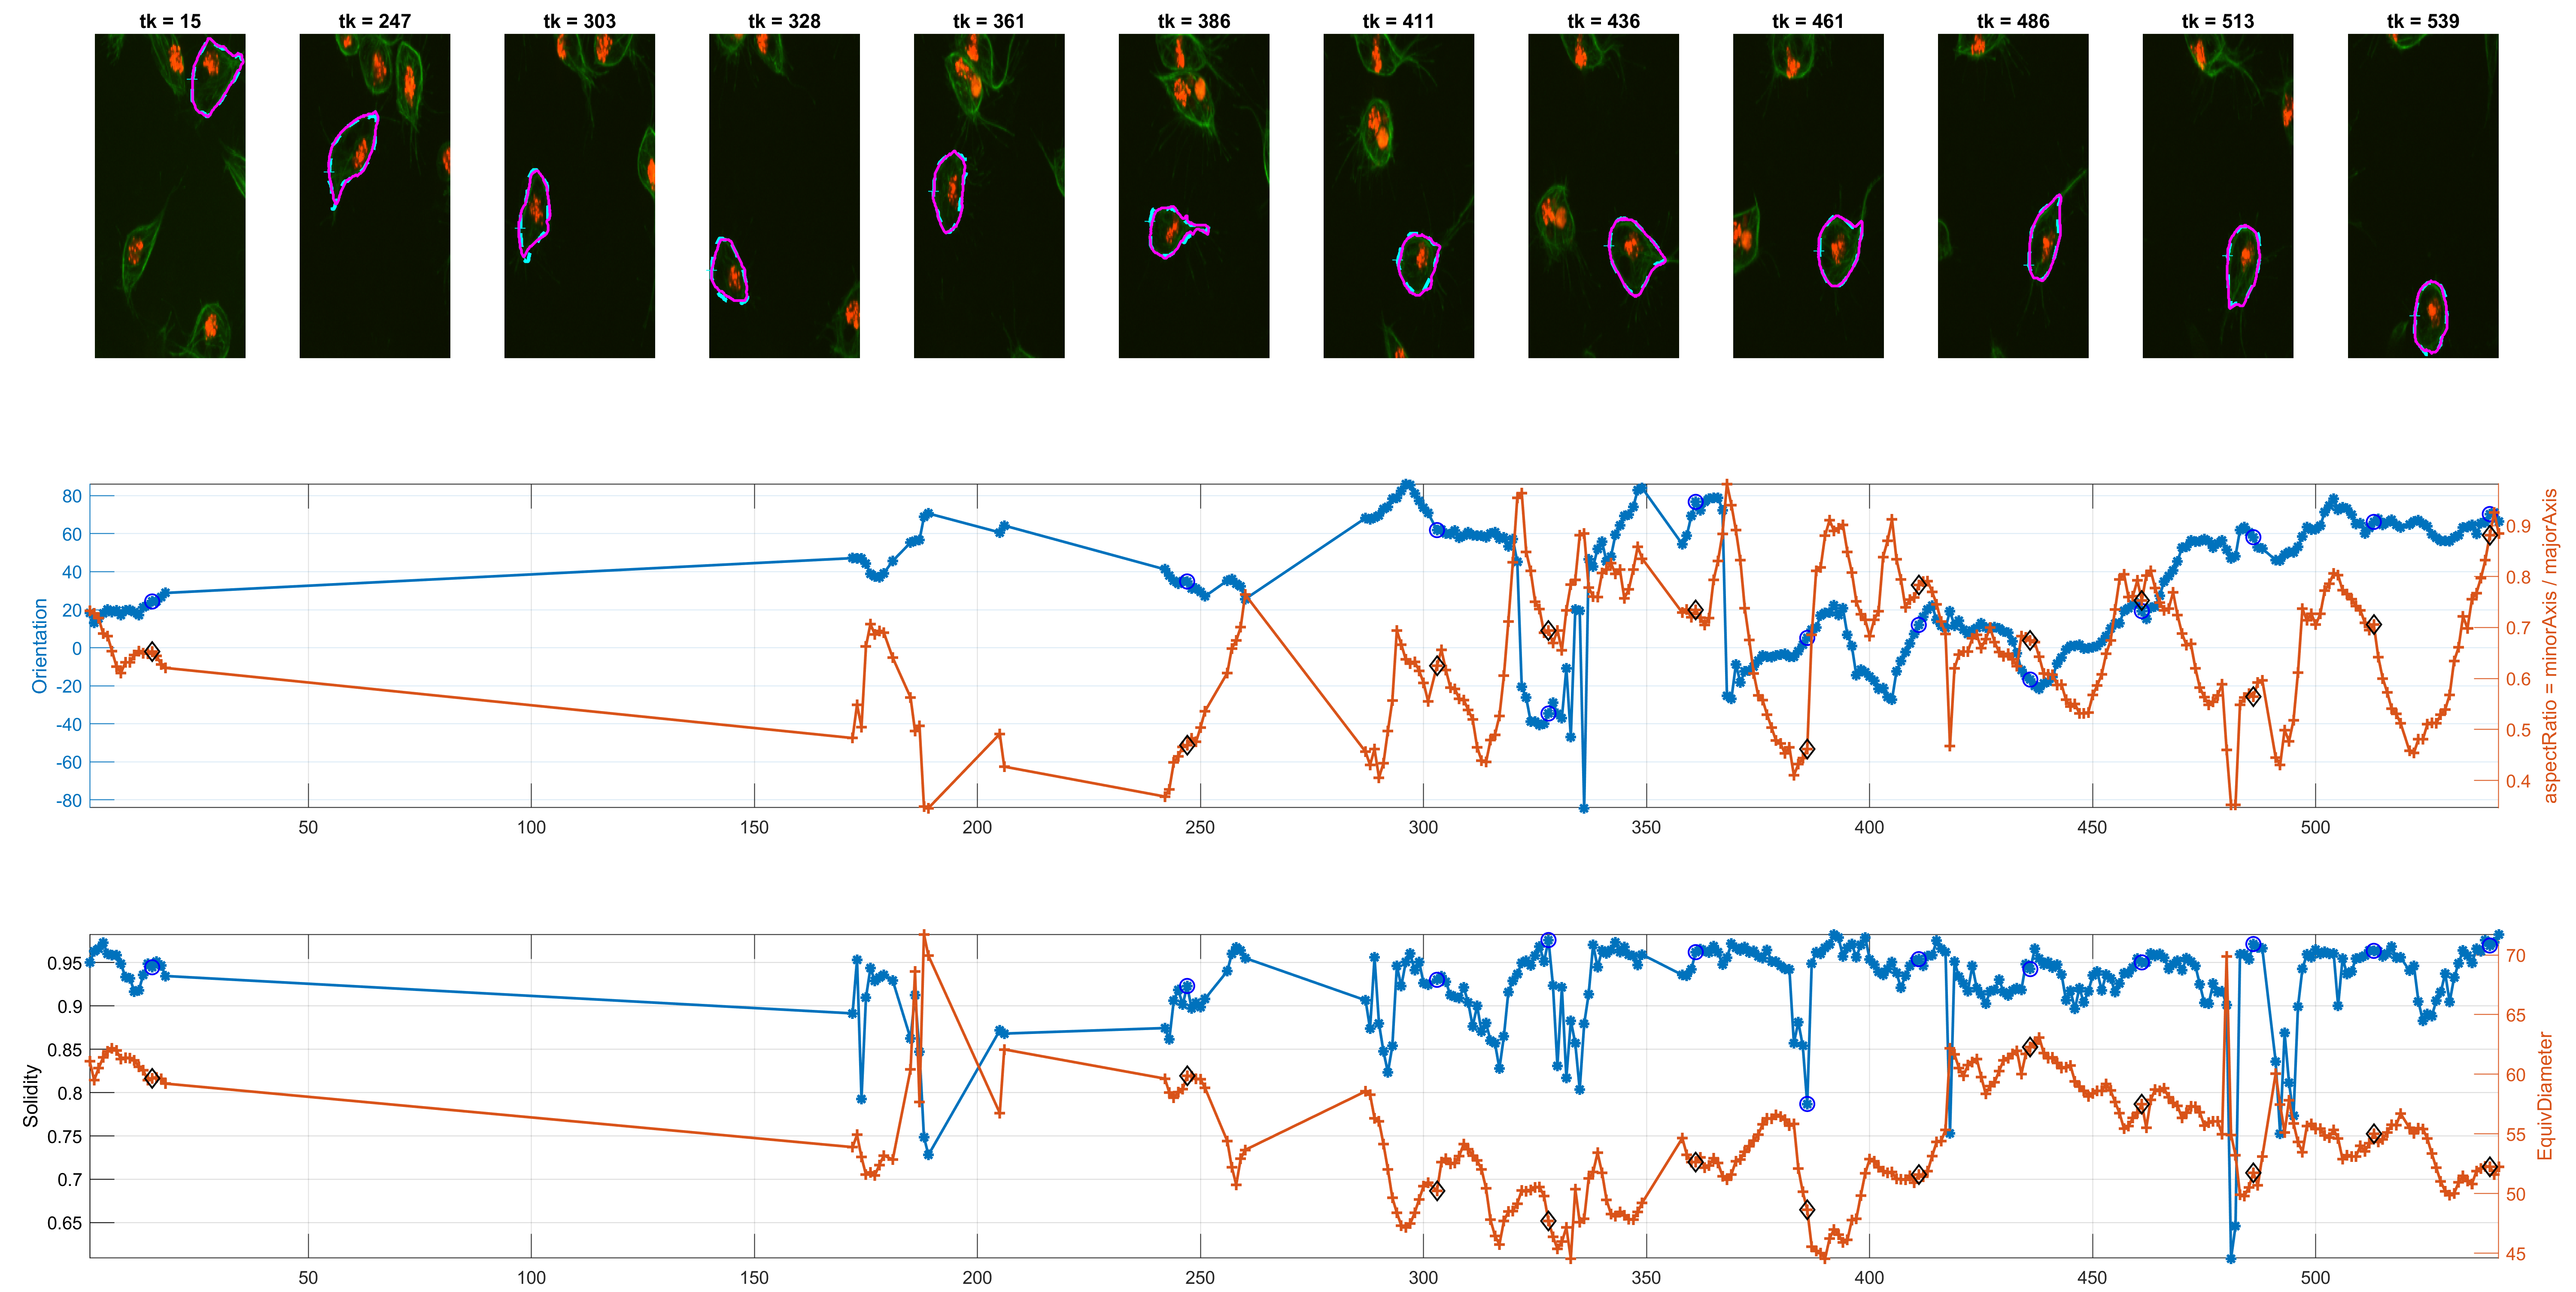
Some preliminary results from track=8 show the detected corners and
spanning in some interesting frames where Orientation and the
aspectRatio variables have interesting behaviour.