scr movementinteractions 0
This file follows the development of the script scr_movementandinteractions.m. In this work, an analysis of the movement of the nuclei in the RED channel will be made, focusing on the interactions that happen before and after a couple of cells leave a clump.
This log will follow the development of the code. The overall flow of the work should:
- Initialise: through initscript.m and by
choosing a clump
whichclump. - Choose the entries in
tablenetthat contain the tracks inwhichclump. Get them into variabletrackinfo. - Evaluate the tracks and choose an appropriate segment of the dataset that shows the cells before and after the clump.
- Analyse the mean velocity before and after a certain amount of frames (10?, 100?, ...)
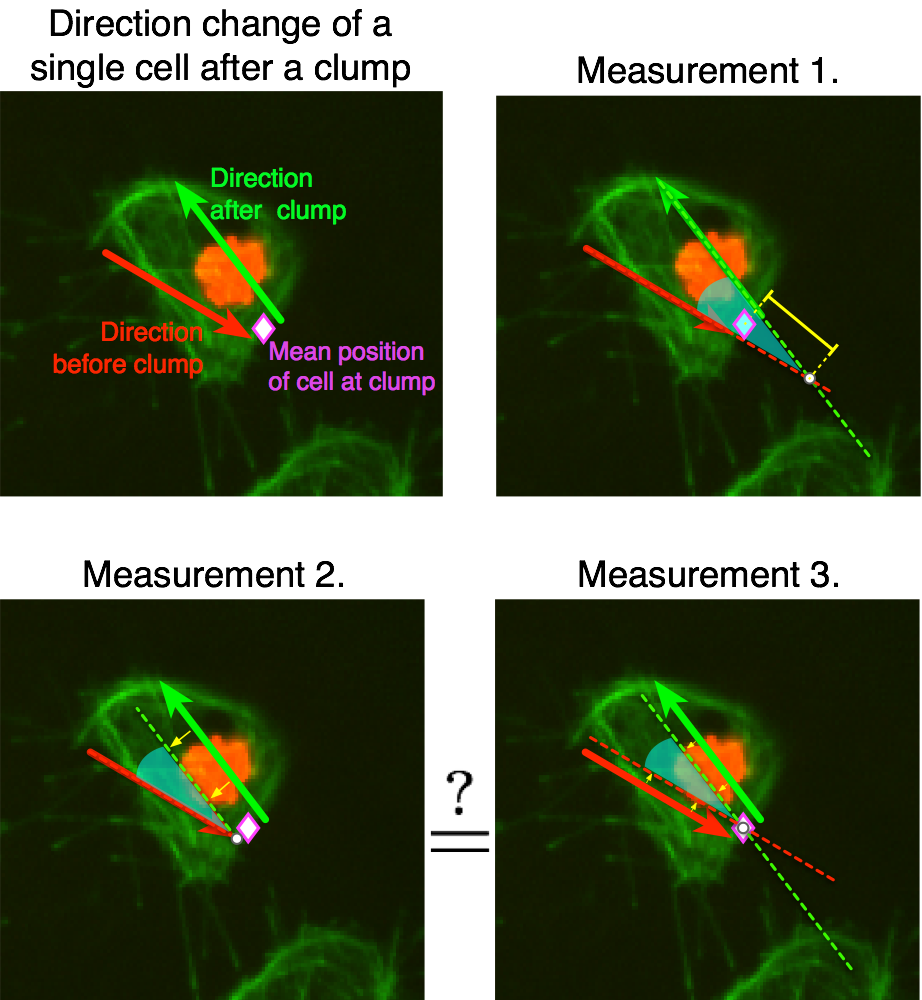
- Analyse the direction before and after the clump (how many frames
back should I consider the direction to be on? ...)
- What to do with clumps that start aggregating with more and more cells?
Several qualitative tests have been carried out in order to determine the
best course of action for the automated analysis.
Function plotframeandpoint.m was developed
to show a frame, with the overlapping and non-overlapping cells, while
displaying a set of points of interest.
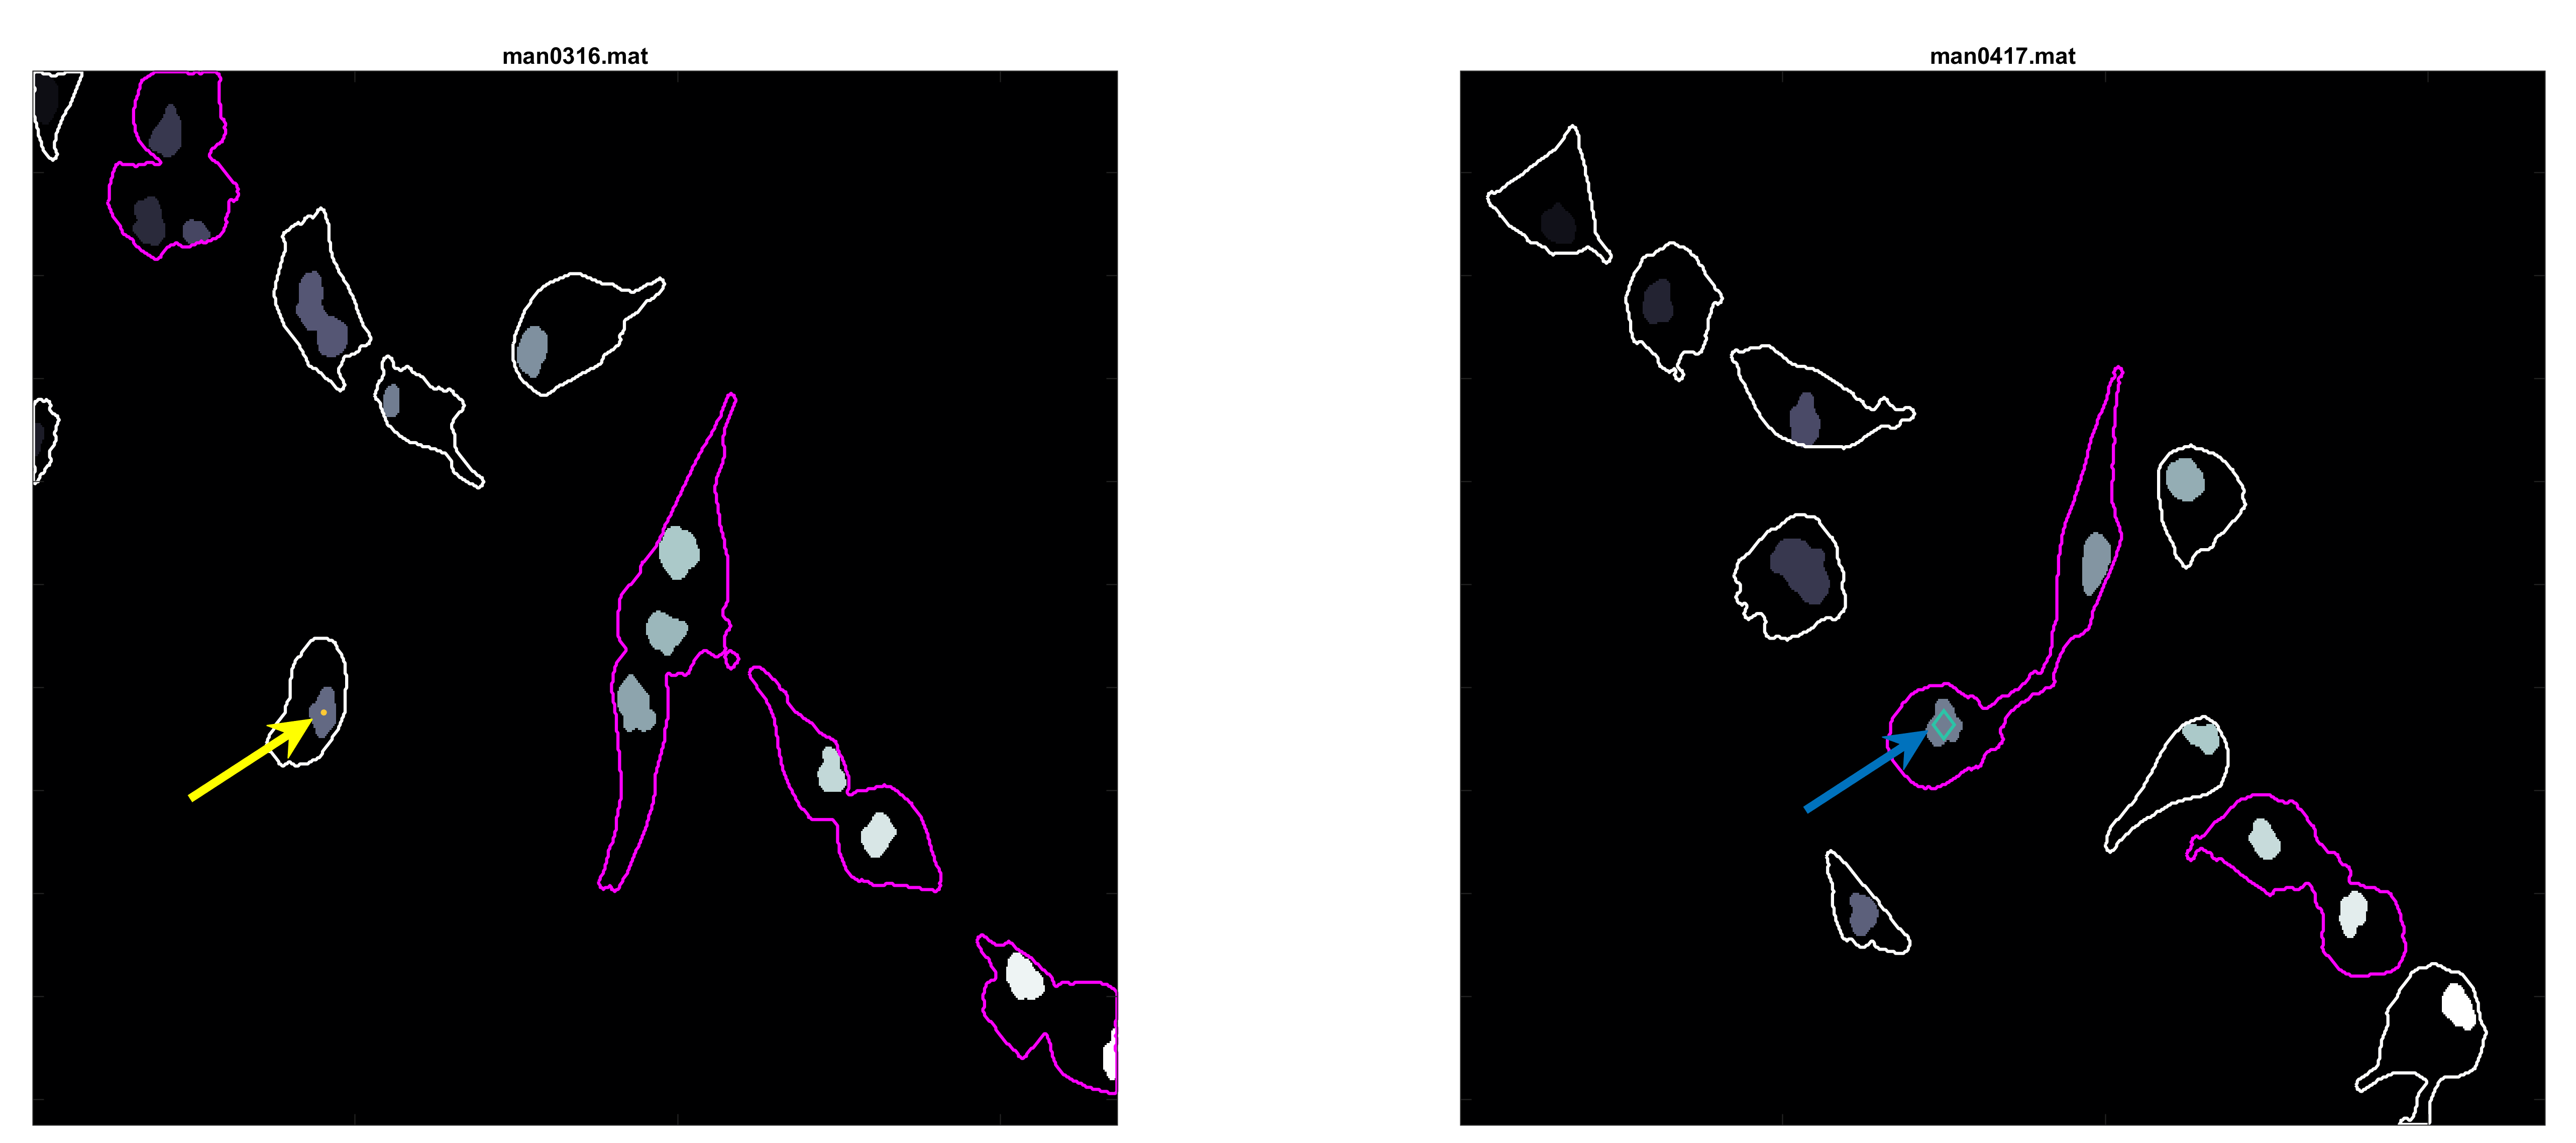
In the figure, two frames of track 8 are shown; on the left, where the
cell is on its own, and on the right some frames later when the cell is
inside a clump. To represent whether the cell is part of a clump or single,
different markers are used (.) for single and diamonds for clumped cells.
Finally, different colours of the parula colourmap are used to display
the different velocities at which the cell is moving in that particular
frame (from blue to yellow).
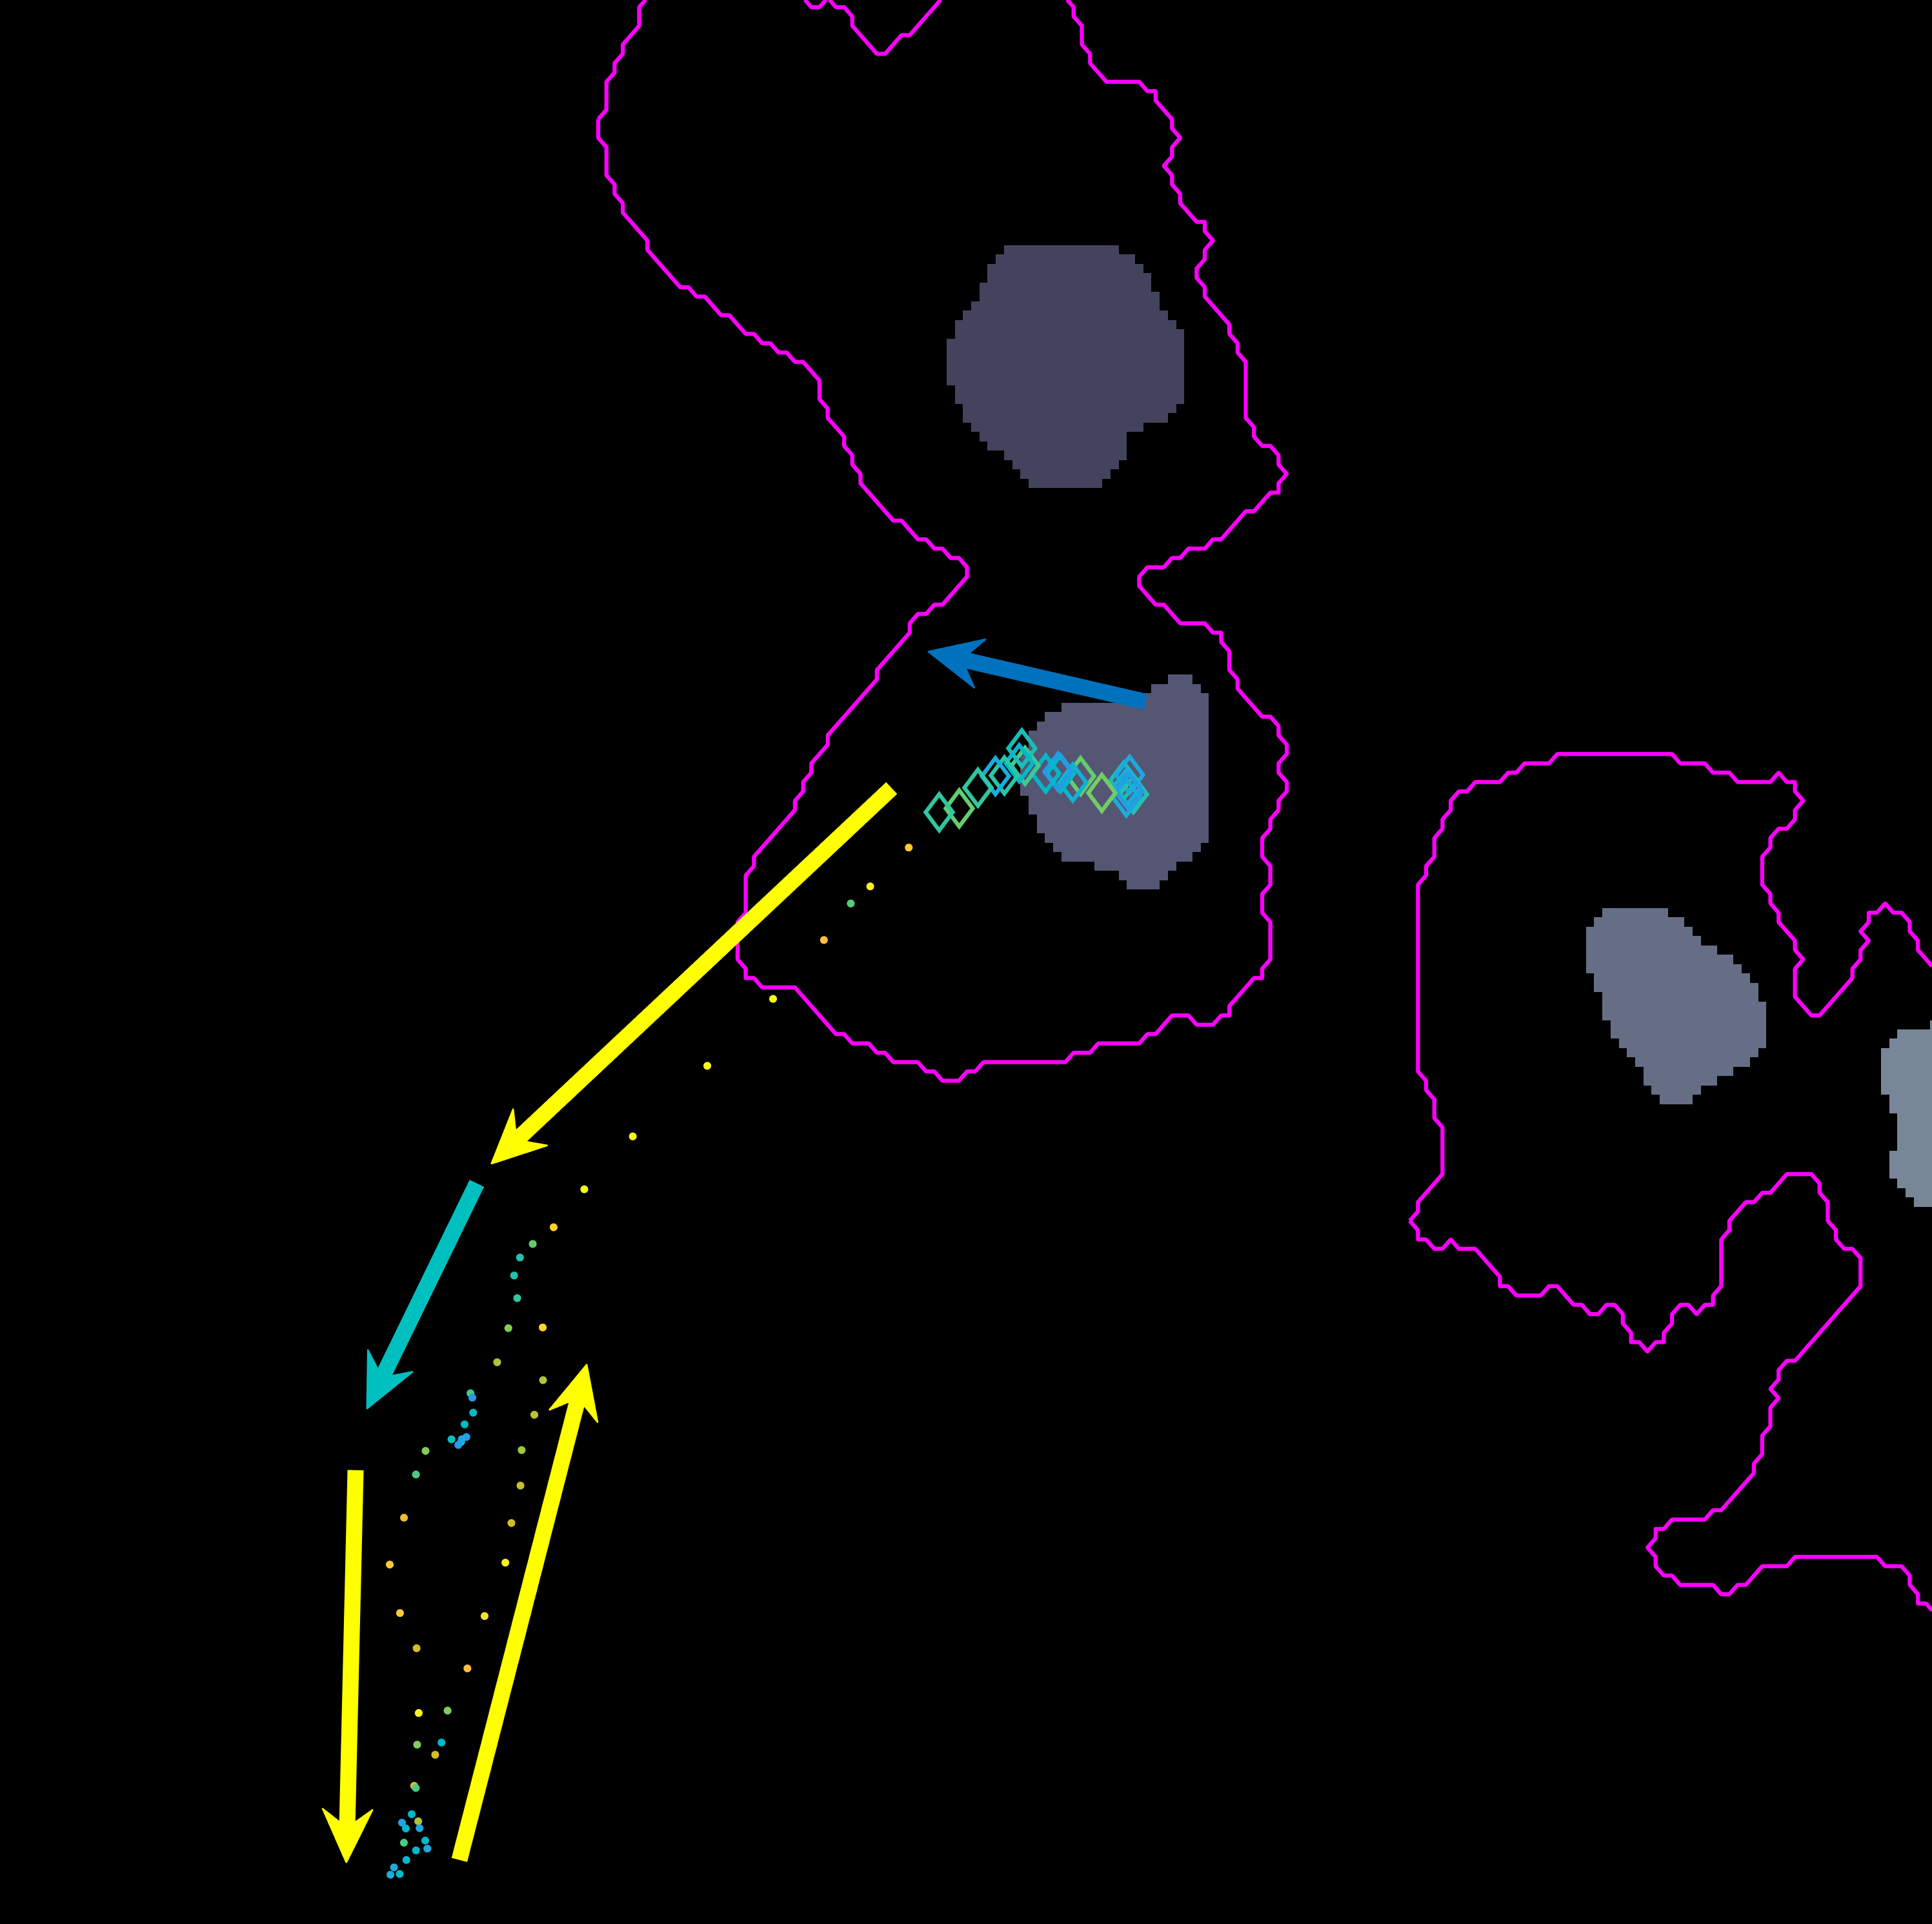
The plotframeandpoint.m function has a mode
in which no image is passed to it, which causes only the designated points
to be shown on an already existing image. The following figure showcases
this mode, arrows were added to highlight the direction of the cells during
the time it was clumped and the times it was out of it. The sequence shown
for track 8 is taken from timeframes 267:346 it shows the first frame
in the sequence, and the progression of the cell as time passes. The
velocity of the frame increases significantly after leaving the clump, then
it appears to stop and then switches direction back up.
Following the path set out before, from frames 306:406, the cell can be
seen switching back to a different clump and then leaving it changing its
original direction.
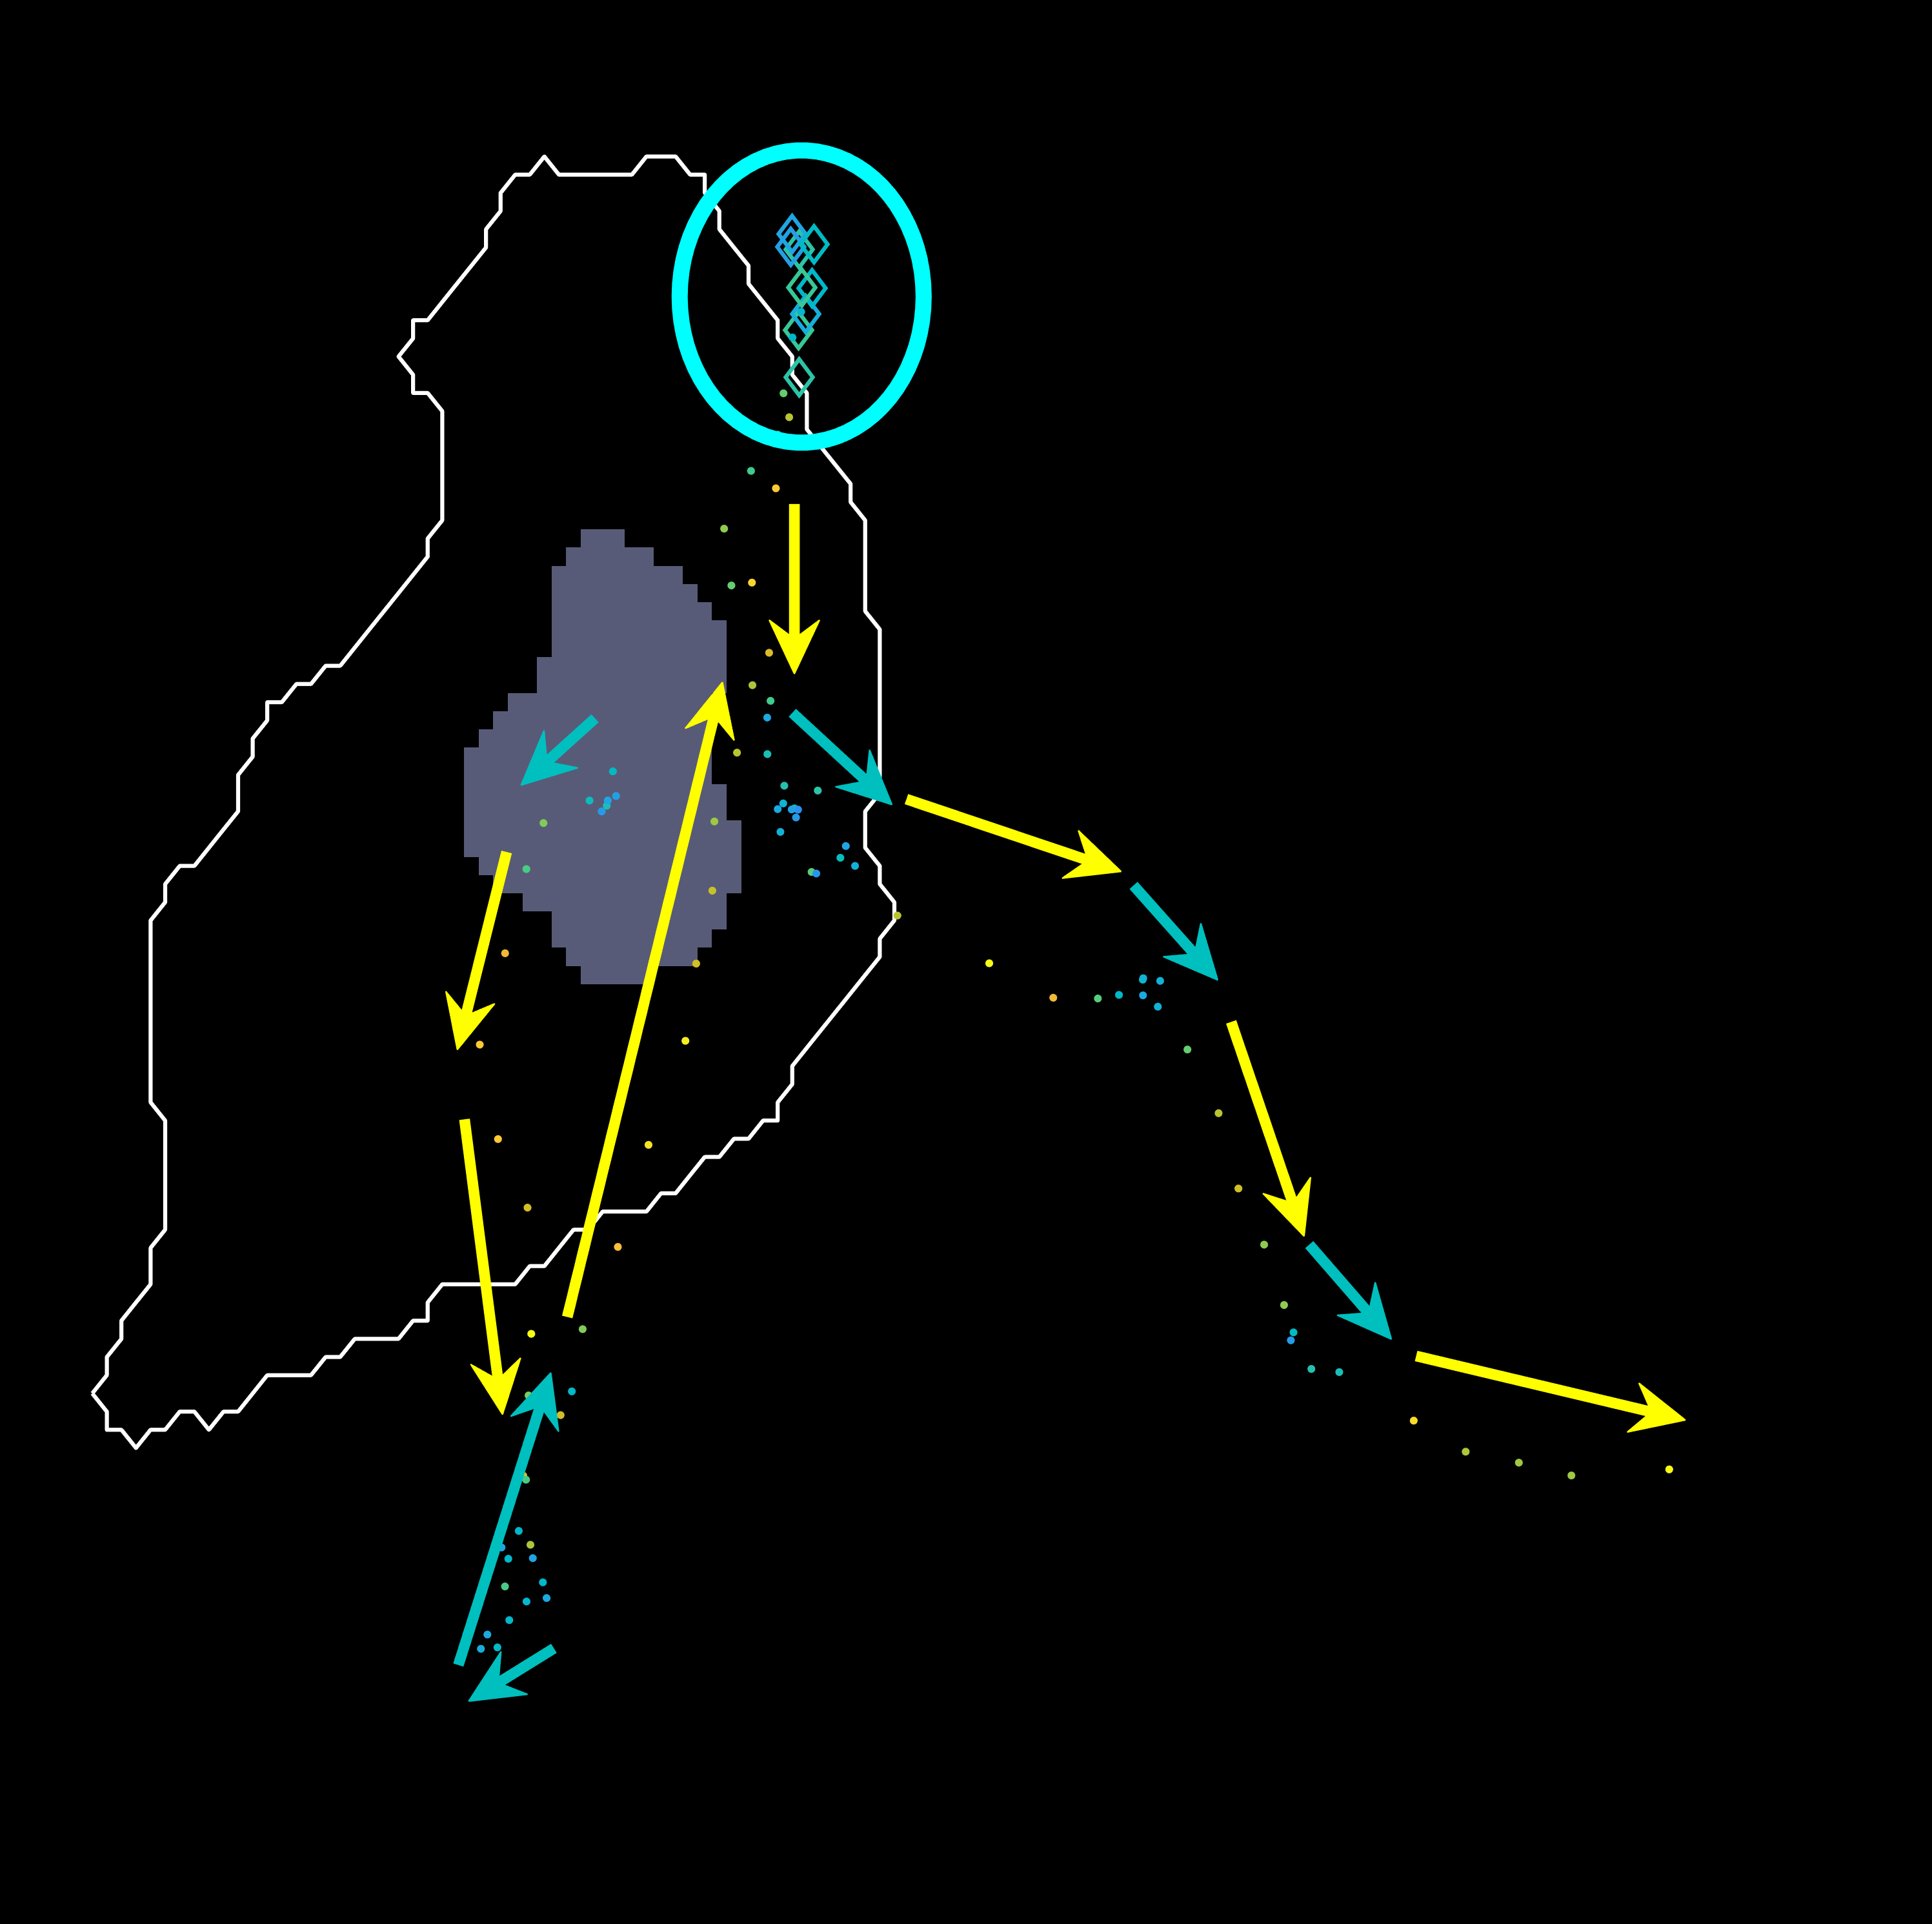
Both pictures include interesting cases for the analysis for that particular cell. More cases have been looked for, but other problems arise when doing so. The visualisation of the entire track segment can be seen below.
A small test can be made to find out the velocity of nuclei within clumps
in variable velclumps and outside of them using variable velsingles.
This can be done through tablenet and clumptracktable in the following
way:
velsingles = tablenet(clumptracktable.clumpcode==0,:).velocity;
velclumps = tablenet(clumptracktable.clumpcode~=0,:).velocity;
mean(velclumps) +/- (std) |
mean(velsingles) +/- (std) |
|---|---|
| 1.6115 +/- (1.3981) | 2.1671 +/- (1.6470) |
A brief analysis was made to see if the difference between both states
(clump and single) was significant for the mean velocity of the nuclei.
The analysis used signrank and it shows that the hypothesis of
velclumps - velsingles having zero median cannot be rejected.
In order to assess the changes in direction, a thorough review of the generated tracks by PhagoSight must be made, ensuring that any suddent change in direction detected was not caused by a track confusing nuclei when the cells were clumped and
The three datasets were analysed this time. The dataset normally used
is dataset MACROS1, while the other two are labelled as MACROS2
and MACROS3. Below see visualisations of the macrophages moving with
the finalLabel next to each track. The colours represent the velocity
of the macrophage at that frame.
MACROS1 dataset
MACROS2 dataset
MACROS2 AN INTERESTING CASE is highlighted below, where two tracks
interact various times and directions seem to change constantlty.
MACROS3 dataset