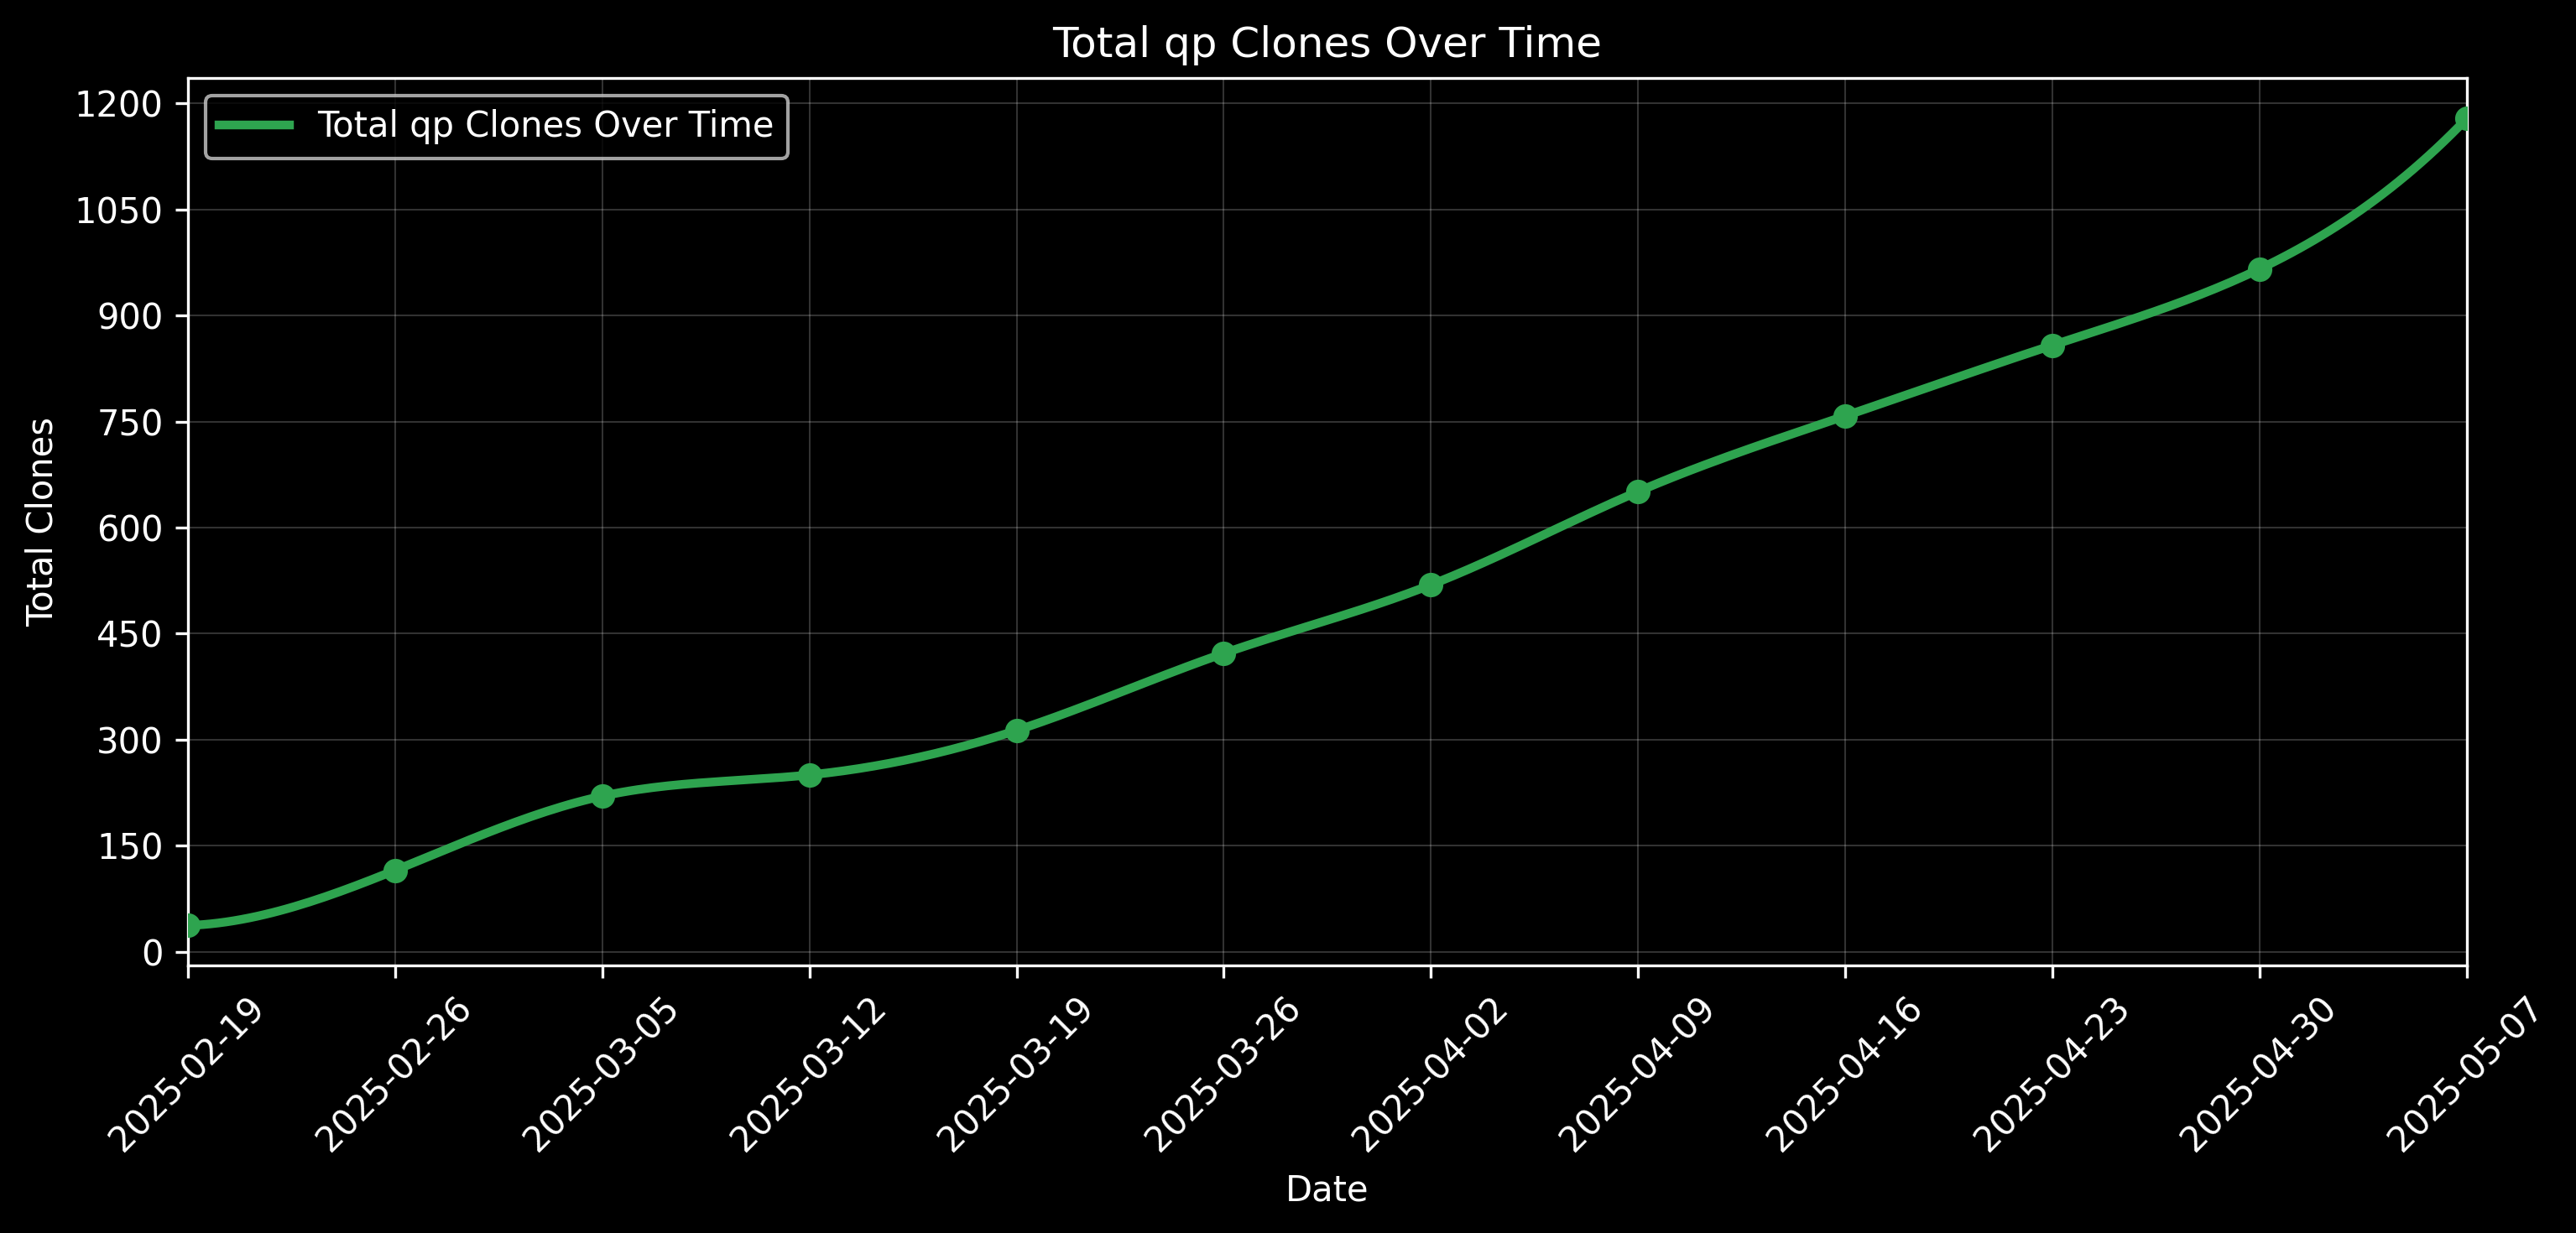
This is a prototype of a CI workflow that visualizes the long term GitHub traffic data for the qp repo.
The CI workflow runs as a cronjob daily near (but not at) midnight UTC.
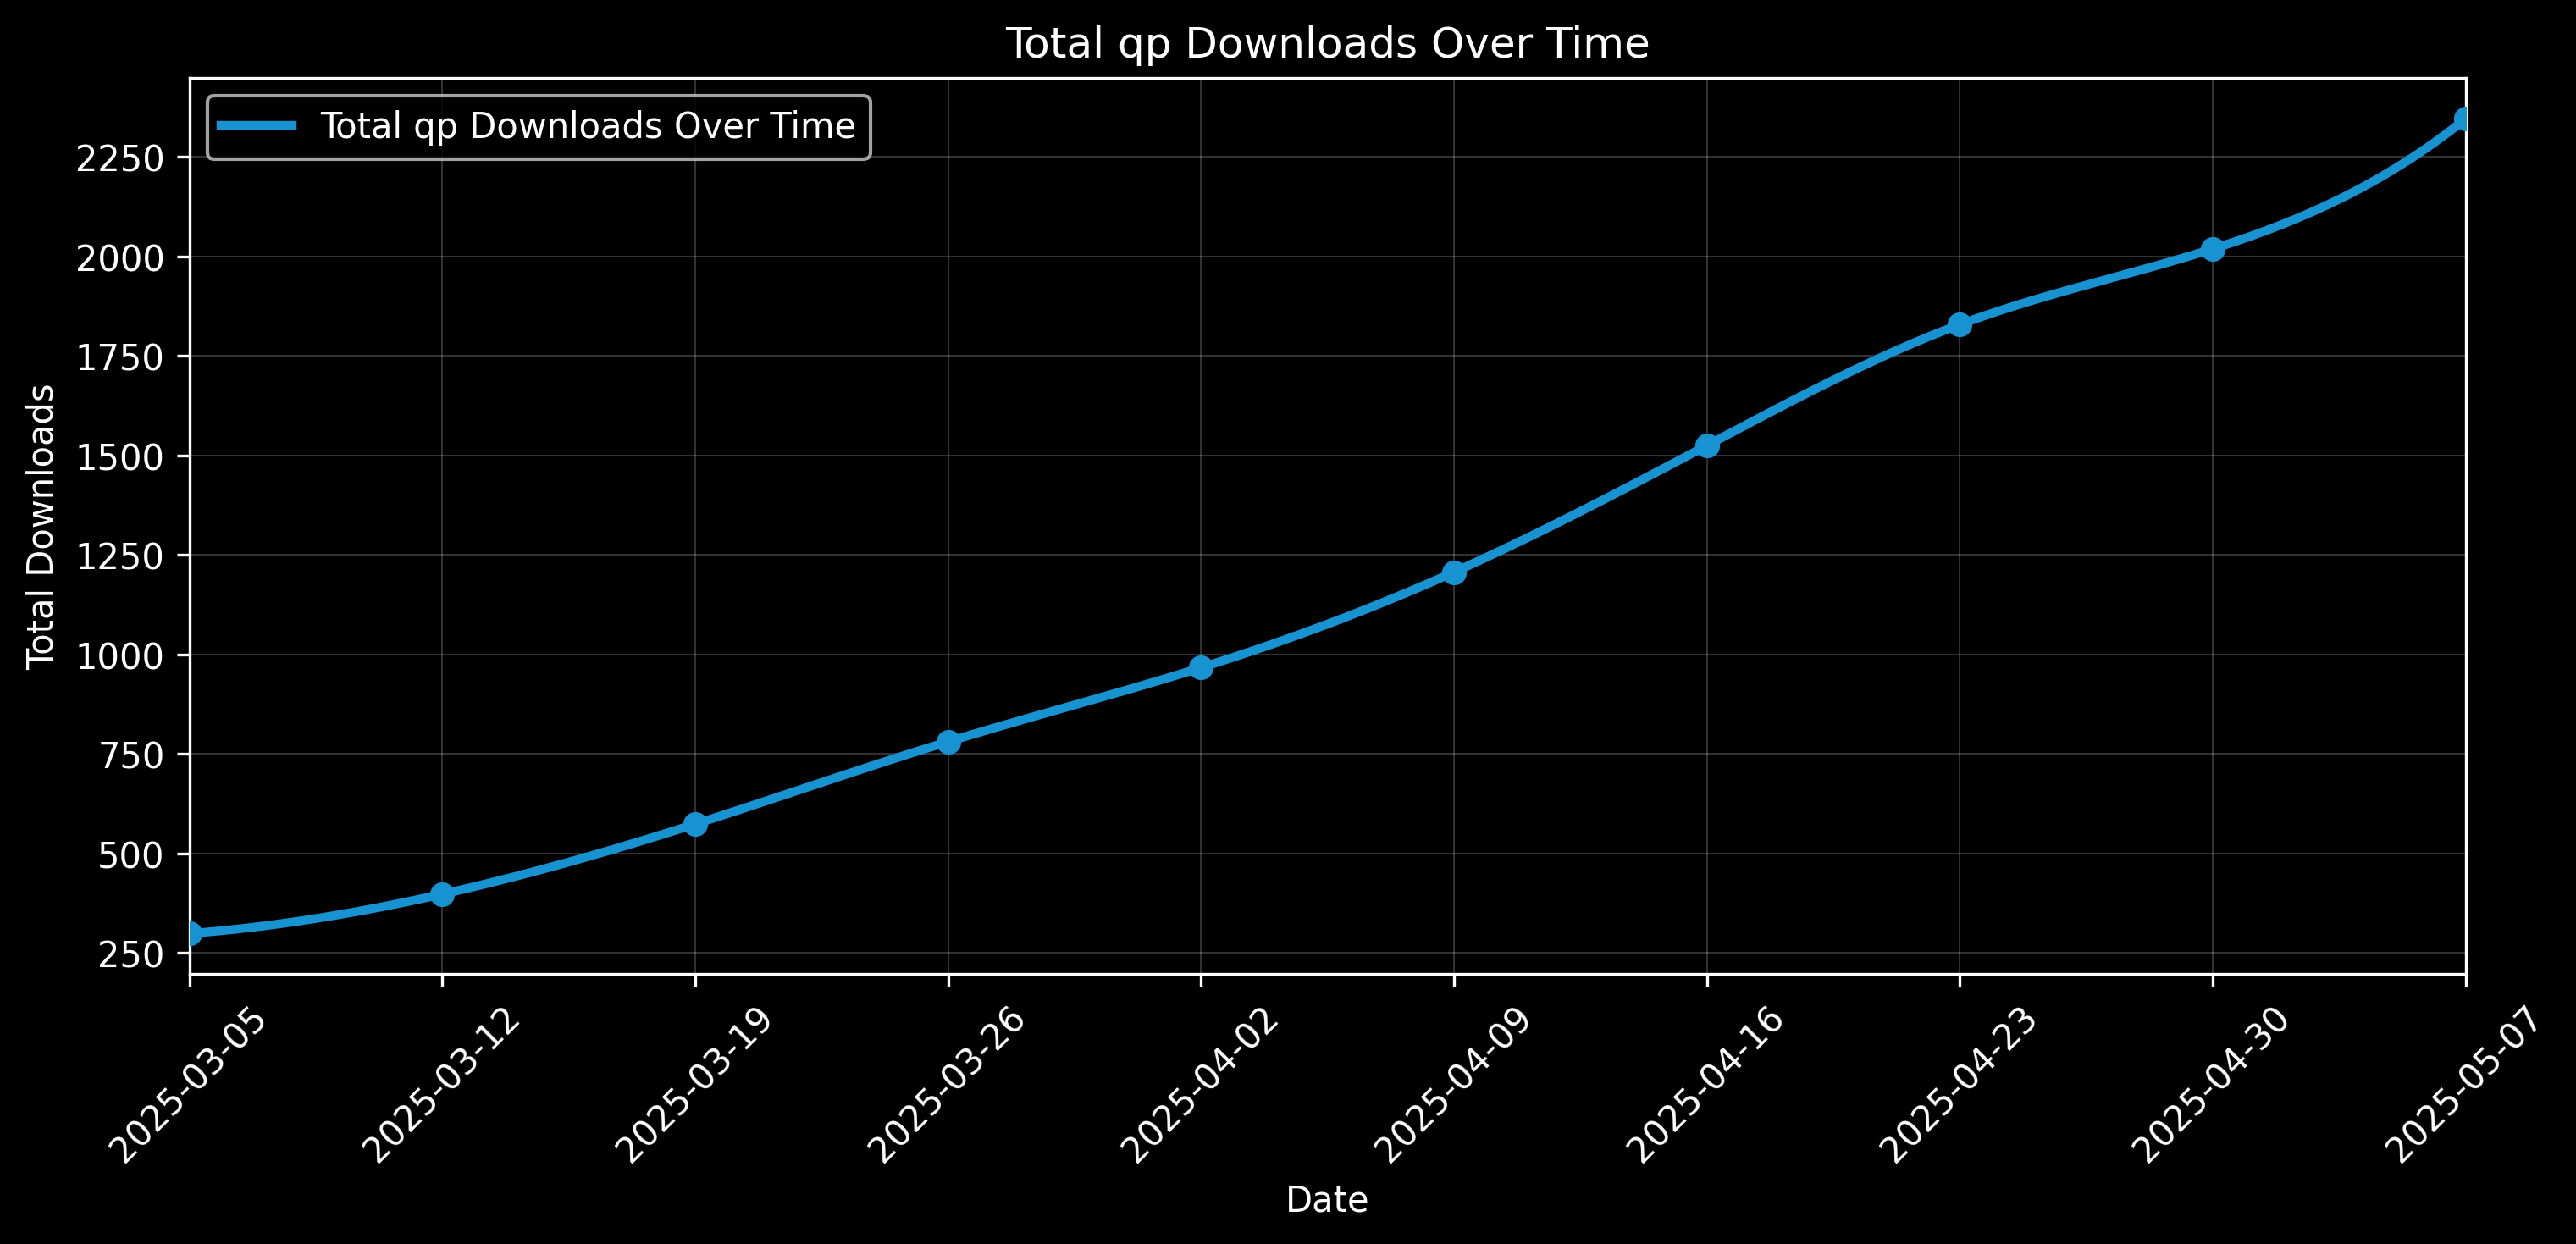
The Go program fetches and organizes the day's traffic data from the GitHub API (we can only get the current total downloads) into a SQLite database.
The SQLite database is stored as a GH Action artifact, so we always have access to all the DBs from the previous 90 days. The SQLite databases are microscopic in storage footprint, so this should never be an issue to store as an artifact.
The Python portion then pulls the data from the SQLite DB and plots the data.
The CI then commits those graph PNGs to an orphan branch (the branch is squashed daily so the repo does not become bloated). The graphs on an orphan branch is useful for hotlinking the images within the same repo or across GitHub.