Thanks for trying the Netdata Agent! In this getting started guide, we'll quickly walk you through the first steps you should take after installing the Agent.
The Agent can collect thousands of metrics in real-time and use its database for long-term metrics storage without any configuration, but there are some valuable things to know to get the most out of Netdata based on your needs.
We'll skip right into some technical details, so if you're brand-new to monitoring the health and performance of systems and applications, our step-by-step guide might be a better fit.
If you haven't installed Netdata yet, visit the installation instructions for details, including our one-liner script, which automatically installs Netdata on almost all Linux distributions.
Open up your web browser of choice and navigate to http://NODE:19999, replacing NODE with the IP address or hostname
of your Agent. Hit Enter. Welcome to Netdata!
What's next?:
- Read more about the standard Netdata dashboard.
- Learn all the specifics of using charts or the differences between charts, context, and families.
Netdata primarily uses the netdata.conf file for custom configurations.
On most systems, you can find that file at /etc/netdata/netdata.conf.
Some operating systems will place your
netdata.confat/opt/netdata/etc/netdata/netdata.conf, so check there if you find nothing at/etc/netdata/netdata.conf.
The netdata.conf file is broken up into various sections, such as [global], [web], [registry], and more. By
default, most options are commented, so you'll have to uncomment them (remove the #) for Netdata to recognize your
change.
Once you save your changes, restart Netdata to load your new configuration.
What's next?:
- Change how long Netdata stores metrics by changing the
page cache sizeanddbengine disk spacesettings innetdata.conf. - Move Netdata's dashboard to a different port or enable TLS/HTTPS encryption.
- See all the
netdata.confoptions in our daemon configuration documentation. - Run your own registry.
Netdata can store long-term, historical metrics out of the box. A custom database uses RAM to store recent metrics, ensuring dashboards and API queries are extremely responsive, while "spilling" historical metrics to disk. This configuration keeps RAM usage low while allowing for long-term, on-disk metrics storage.
You can tweak this custom database engine to store a much larger dataset than your system's available RAM, particularly if you allow Netdata to use slightly more RAM and disk space than the default configuration.
Read our guide on changing how long Netdata stores metrics to learn more and use our database engine calculator to figure out the exact settings you'll need to store historical metrics right in the Agent's database.
What's next?:
- Learn more about the memory requirements for the database engine to understand how much RAM/disk space you should commit to storing historical metrics.
When Netdata starts, it auto-detects dozens of data sources, such as database servers, web servers, and more. To auto-detect and collect metrics from a service or application you just installed, you need to restart Netdata.
There is one exception: When Netdata is running on the host (as in not in a container itself), it will always auto-detect containers and VMs.
However, auto-detection only works if you installed the source using its standard installation procedure. If Netdata isn't collecting metrics after a restart, your source probably isn't configured correctly. Look at the external plugin documentation to find the appropriate module for your source. Those pages will contain more information about how to configure your source for auto-detection.
Some modules, like chrony, are disabled by default and must be enabled manually for auto-detection to work.
Once Netdata detects a valid source of data, it will continue trying to collect data from it. For example, if Netdata is collecting data from an Nginx web server, and you shut Nginx down, Netdata will collect new data as soon as you start the web server back up—no restart necessary.
Even if Netdata auto-detects your service/application, you might want to configure what, or how often, Netdata is collecting data.
Netdata uses internal and external plugins to collect data. Internal plugins run within the Netdata dæmon, while external plugins are independent processes that send metrics to Netdata over pipes. There are also plugin orchestrators, which are external plugins with one or more data collection modules.
You can configure both internal and external plugins, along with the individual modules. There are many ways to do so:
- In
netdata.conf,[plugins]section: Enable or disable internal or external plugins withyesorno. - In
netdata.conf,[plugin:XXX]sections: Each plugin has a section for changing collection frequency or passing options to the plugin. - In
.conffiles for each external plugin: For example, at/etc/netdata/python.d.conf. - In
.conffiles for each module : For example, at/etc/netdata/python.d/nginx.conf.
It's complex, so let's walk through an example of the various .conf files responsible for collecting data from an
Nginx web server using the nginx module and the python.d plugin orchestrator.
First, you can enable or disable the python.d plugin entirely in netdata.conf.
[plugins]
    # Enabled
    python.d = yes
    # Disabled
    python.d = no
You can also configure the entire python.d external plugin via the [plugin:python.d] section in netdata.conf.
Here, you can change how often Netdata uses python.d to collect metrics or pass other command options:
[plugin:python.d]
    update every = 1
    command options =
The python.d plugin has a separate configuration file at /etc/netdata/python.d.conf for enabling and disabling
modules. You can use the edit-config script to edit the file, or open it with your text editor of choice:
sudo /etc/netdata/edit-config python.d.confFinally, the nginx module has a configuration file called nginx.conf in the python.d folder. Again, use
edit-config or your editor of choice:
sudo /etc/netdata/edit-config python.d/nginx.confIn the nginx.conf file, you'll find additional options. The default works in most situations, but you may need to make
changes based on your particular Nginx setup.
What's next?:
- Look at the full list of data collection modules to configure your sources for auto-detection and monitoring.
- Improve the performance of Netdata on low-memory systems.
- Configure
systemdto expose systemd services utilization metrics automatically. - Reconfigure individual charts in
netdata.conf.
Netdata comes with hundreds of health monitoring alarms for detecting anomalies on production servers. If you're running Netdata on a workstation, you might want to disable Netdata's alarms.
Edit your /etc/netdata/netdata.conf file and set the following:
[health]
    enabled = no
If you want to keep health monitoring enabled, but turn email notifications off, edit your health_alarm_notify.conf
file with edit-config, or with the text editor of your choice:
sudo /etc/netdata/edit-config health_alarm_notify.confFind the SEND_EMAIL="YES" line and change it to SEND_EMAIL="NO".
What's next?:
- Follow the health quickstart to locate and edit existing health entities, and then create your own.
- See all the alarm options via the health configuration reference.
- Add a new notification method, like Slack.
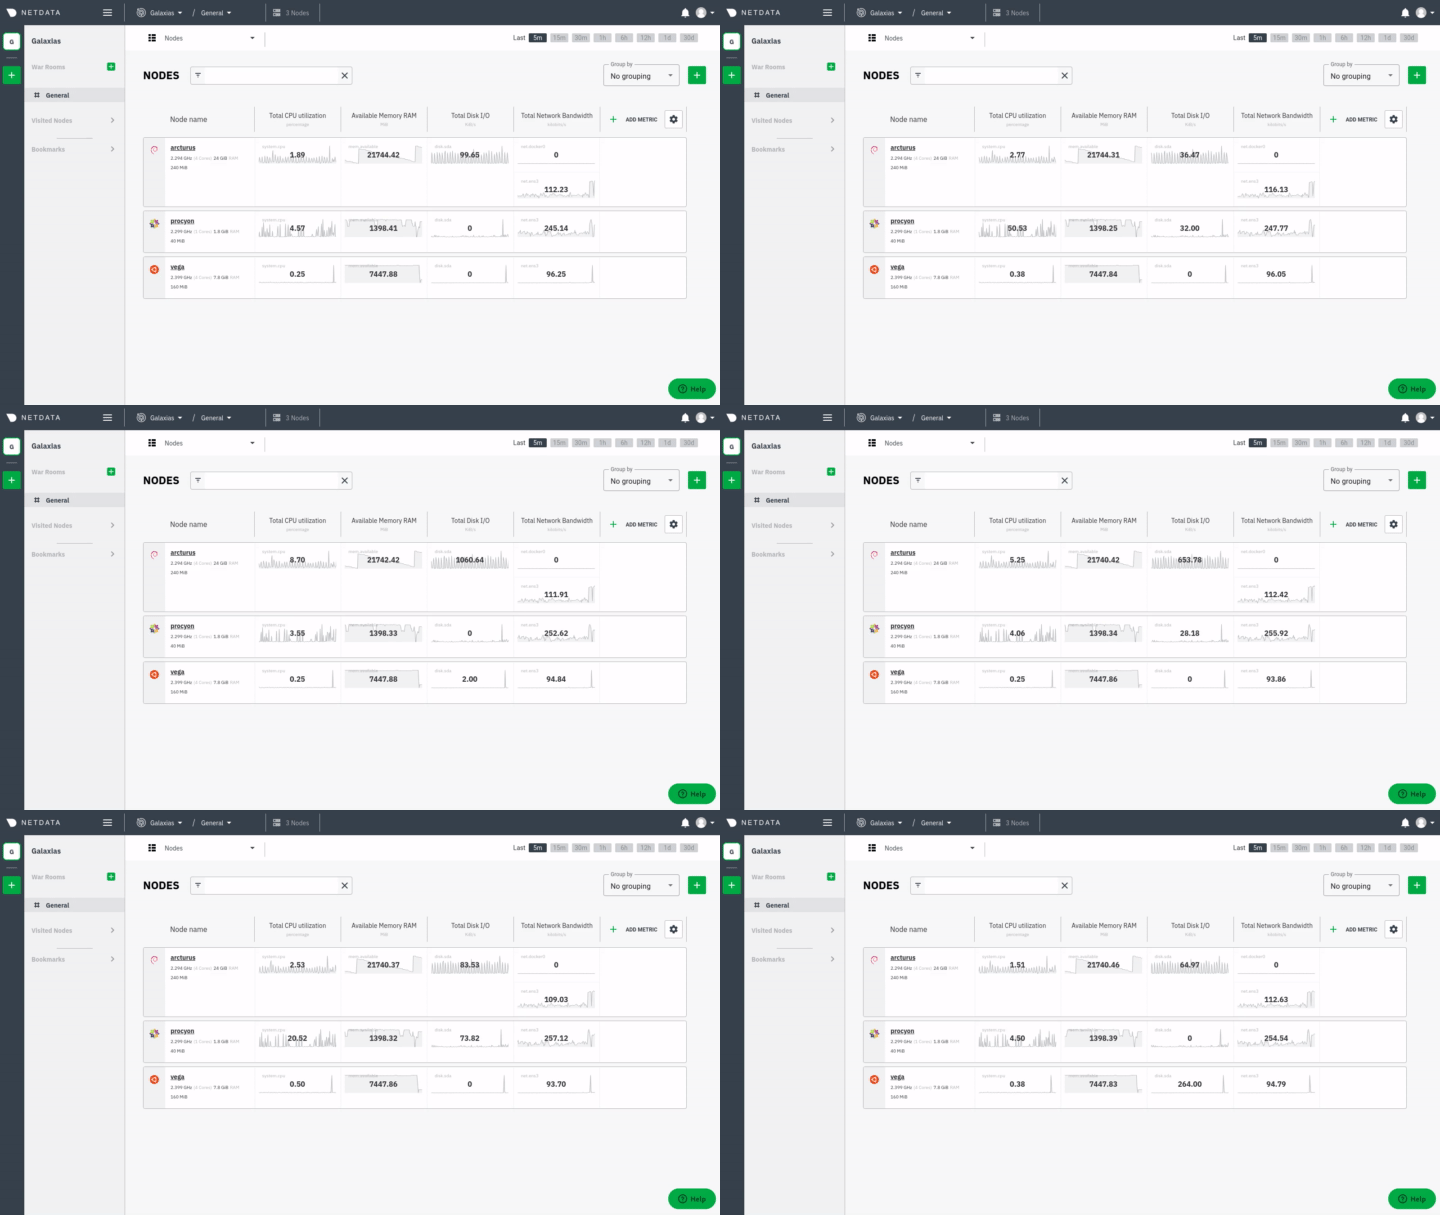
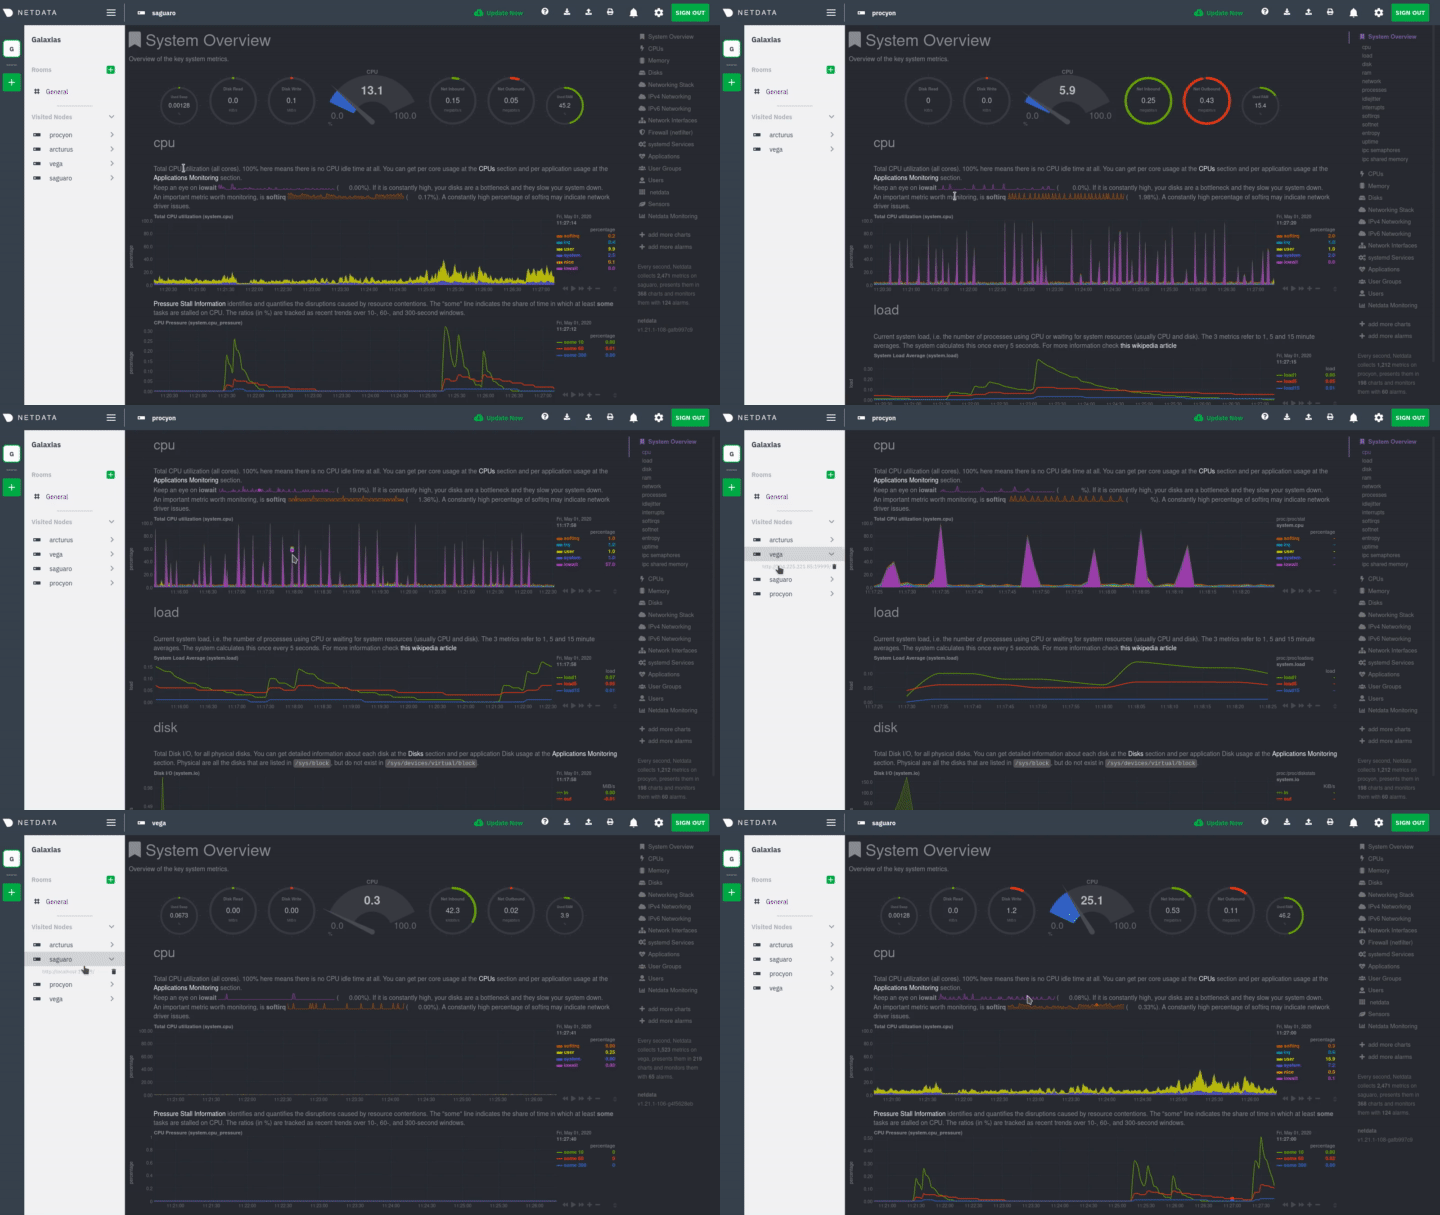
If you have the Agent installed on multiple nodes, you can use Netdata Cloud in two ways: Monitor the health and performance of an entire infrastructure via the Cloud web interface, or use the Visited Nodes menu that's built into every dashboard.
For example, a small infrastructure monitored via Netdata Cloud:
And the process of using the Visited nodes menu to move between Agent dashboards running on various systems, both local and remote:
You can use these features together or separately—the decision is up to you and the needs of your infrastructure.
What's next?:
- Read about the Agent-Cloud integration.
- Get an overview of Cloud's features by reading Cloud documentation.
- Follow the 5-minute get started with Cloud guide to finish onboarding and claim your first nodes.
- Better understand how agents connect securely to the Cloud with claiming and Agent-Cloud link documentation.
When you install Netdata, it's configured to start at boot, and stop and restart/shutdown. You shouldn't need to start or stop Netdata manually, but you will probably need to restart Netdata at some point.
- To start Netdata, open a terminal and run
service netdata start. - To stop Netdata, run
service netdata stop. - To restart Netdata, run
service netdata restart.
The service command is a wrapper script that tries to use your system's preferred method of starting or stopping
Netdata based on your system. But, if either of those commands fails, try using the equivalent commands for systemd
and init.d:
- systemd:
systemctl start netdata,systemctl stop netdata,systemctl restart netdata - init.d:
/etc/init.d/netdata start,/etc/init.d/netdata stop,/etc/init.d/netdata restart
Even after you've configured netdata.conf, tweaked alarms, learned the basics of performance troubleshooting, and
claimed all your systems in Netdata Cloud or added them to the Visited nodes menu, you've just gotten started with
Netdata.
Take a look at some more advanced features and configurations:
- Centralize Netdata metrics from many systems with streaming
- Enable long-term archiving of Netdata metrics via exporting engine to time-series databases.
- Improve security by putting Netdata behind an Nginx proxy with SSL.
Or, learn more about how you can contribute to Netdata core or our documentation!


