To get you interested here are a few short examples (some snippets might require newer kernels ~ > 5.5):
on one console:
./inject.py kmalloc '__x64_sys_mount()'

and on another, try mounting a filesystem:

# mount /dev/sdb1 /mnt
mount: /mnt: mount(2) system call failed: Cannot allocate memory.
inject.py is a tool from the BCC toolkit which is a python wrapper for bpf libraries (libbcc, libbpf). The next examples use bpftrace which is a separate tool with awk-like syntax. More of a simple scripting tool with way easier access to bpf functionality. Both use the same libraries and have almost the same capabilities.
bpftrace -e 'k:__x64_sys_getuid /comm == "id"/ { override(1337); }' --unsafe
and on another console:
# id
uid=1337 gid=0(root) euid=0(root) groups=0(root)

or use the -c switch:

bpftrace -v -e 'k:__x64_sys_getuid /comm == "id"/ { override(1337); }' --unsafe -c "/usr/bin/id"
You guessed correctly. The two snippets override the return value using bpf_override_return() which completely overwrites the syscall, i.e. does not call it, and just returns the int value. (Press CTRL+C to cancel and note that override only works for functions marked ALLOW_ERROR_INJECTION, mostly syscalls and just a few others and it can only return an unsigned long.)
To use bpftrace scripts for a duration of a few seconds use "timeout --signal=SIGINT bpftrace ..." and don't forget the signal or else at least for old kernels ~4.15 the bpf program will stay in kernel space and will remain active (use /bcc/tools/reset-trace.sh from BCC repository to clear everything).
You would like to see what someone else is doing on your system? Just use the following script. Save and change "pts42" to the pts# you would like to monitor.
#!/usr/bin/env bpftrace
#include <linux/tty.h>
kprobe:pty_write{
$ttystruct = (struct tty_struct *)arg0;

  if($ttystruct->name == "pts42"){
	  printf("test: %s %s\n", $ttystruct->name, str(arg1));
  }
}
Quick way to get the size of kernel structs:
bpftrace -e '#include <linux/sched.h>  \
BEGIN { printf("%d\n", sizeof(struct task_struct)); }  '
Attaching 1 probe...
9152
^C

or use --include:

bpftrace --include 'linux/sched.h' -e 'BEGIN { printf("%d\n", sizeof(struct task_cputime)); }  '
Attaching 1 probe...
24
^C
If you have BTF (BPF type format: i.e. all kernel structs and types in compact format) support, which is recommended for BPF debugging, you can omit the include part. You can check for BTF support with bpftrace --info. Add CONFIG_DEBUG_INFO_BTF=y/CONFIG_DEBUG_INFO=y to kernel (check if /sys/kernel/btf/vmlinux exists) and make sure you use the libbpf from your currently running kernel (make install install_headers in /usr/src/linux/tools/lib/bpf, compile bpftrace afterwards).
From kernel src: Documentation/bpf/btf.rst:
BTF (BPF Type Format) is the metadata format which encodes the debug info
related to BPF program/map. The name BTF was used initially to describe data
types. The BTF was later extended to include function info for defined
subroutines, and line info for source/line information.
(side note: pahole from (https://git.kernel.org/pub/scm/devel/pahole/pahole.git/) is also needed to extract BTF information after building a kernel and is als a great tool per se. E.g. (from the man-page, pahole v1.17) pahole −s |sort −k2 −nr|head -50 prints the 50 biggest kernel structs using the /sys/kernel/btf/vmlinux file:
cmp_data	290904	1
dec_data	274520	1
rcu_state	267264	7
cpu_entry_area	208896	0
pglist_data	172928	5
ZSTD_DCtx_s	155968	1
saved_cmdlines_buffer	131104	1
debug_store_buffers	131072	0
blkfront_ring_info	82144	2
E.g. saved_cmdlines_buffer is used by tracing tools to print the command names.
To print structs and in which file they are defined in:
# pahole -Fdwarf -I saved_cmdlines_buffer
/* Used at: kernel/trace/trace.c */
/* <28bc745> kernel/trace/trace.c:1941 */
struct saved_cmdlines_buffer {
	unsigned int               map_pid_to_cmdline[32769]; /*     0 131076 */

	/* XXX 4 bytes hole, try to pack */

	/* --- cacheline 2048 boundary (131072 bytes) was 8 bytes ago --- */
	unsigned int *             map_cmdline_to_pid;   /* 131080     8 */
	unsigned int               cmdline_num;          /* 131088     4 */
	int                        cmdline_idx;          /* 131092     4 */
	char *                     saved_cmdlines;       /* 131096     8 */

	/* size: 131104, cachelines: 2049, members: 5 */
	/* sum members: 131100, holes: 1, sum holes: 4 */
	/* last cacheline: 32 bytes */
};
pahole cmp_data to print where the (largest) struct:
# pahole -Fdwarf -I cmp_data
/* Used at: kernel/power/swap.c */
/* <1e0b44c> kernel/power/swap.c:618 */
All structs including wait_queue_head_t:
# pahole --contains wait_queue_head_t | wc -l
110
Expand inner structs with --expand_types.
# pahole --expand_types task_struct
struct task_struct {
       struct thread_info {
               long unsigned int  flags;                                                /*     0     8 */
               /* typedef u32 -> __u32 */ unsigned int       status;                    /*     8     4 */
       } thread_info; /*     0    16 */

[... ~ 900 more lines]
What's the kernel doing exactly? GDB/qemu/etc only gets you so far, maybe till the init(1) process because the setup code is linear and not concurrent. But to get a feel for the up to millions of function calls per second you need better tools: BCC and especially bpftrace helps a lot when you want to take a quick look. Those are two newer tools popularized by Brendan Gregg (*www.brendangregg.com), explained in lenghty detail in his book: "BPF Performance Tools", 2019 (ISBN-10: 0-13-655482-2) and on lots of blog posts. Of the two, bpftrace is my weapon of choice because the syntax is easy and sufficient for a lot of stuff.
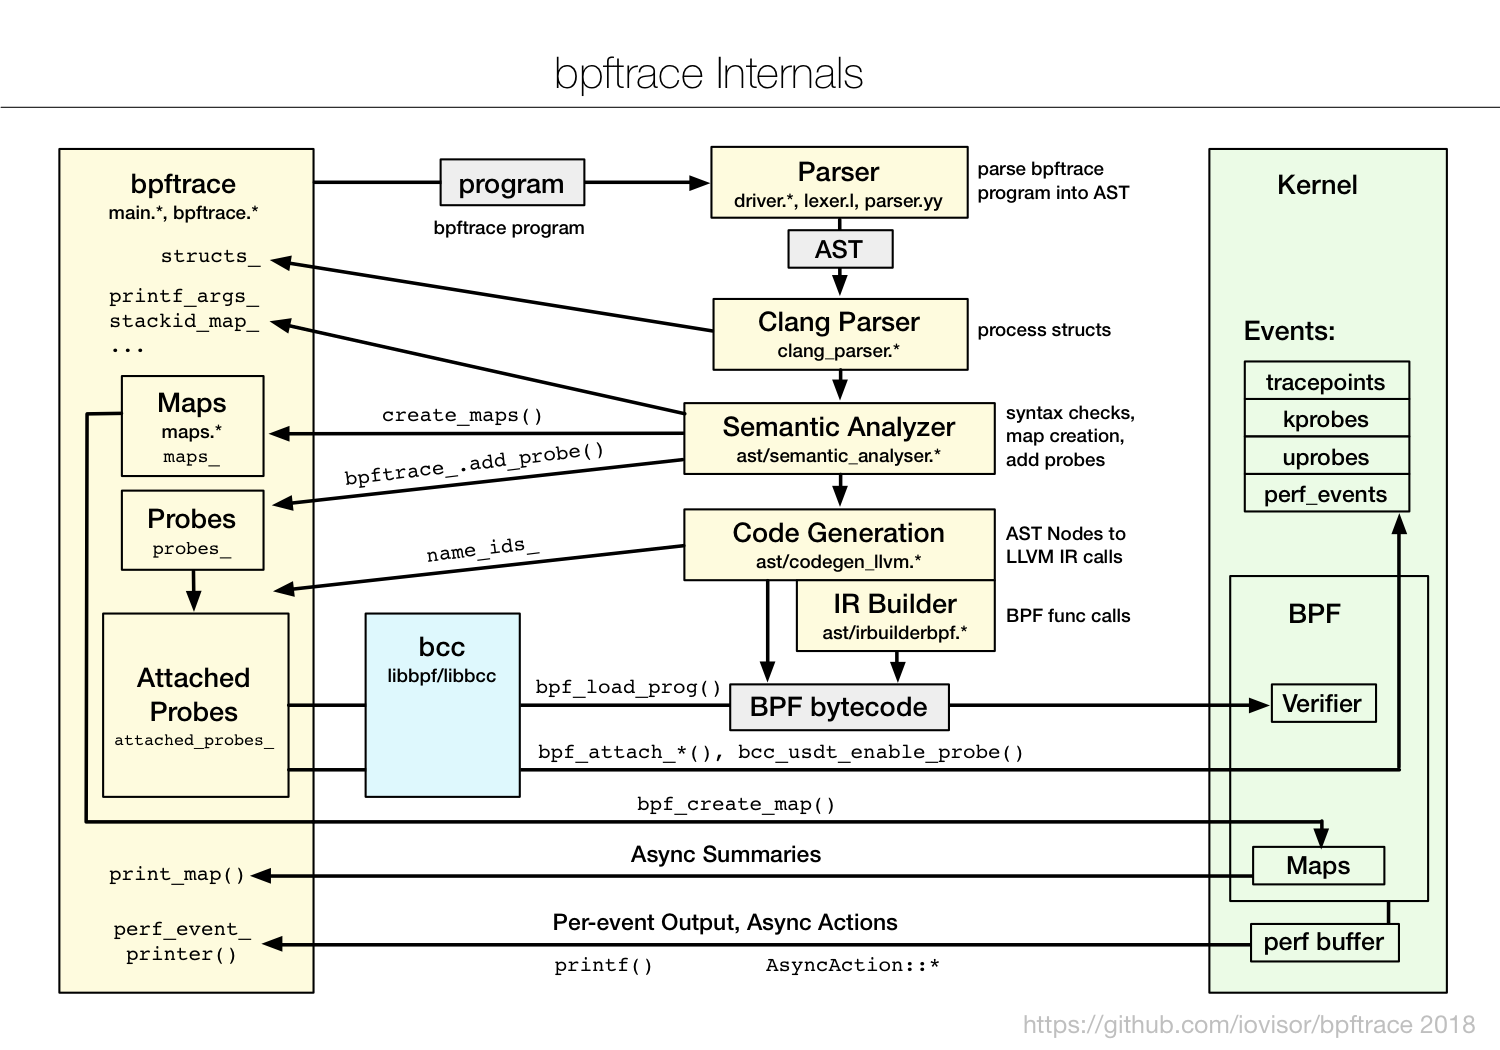
As you can see from the diagram, bpftrace is quite involved. There are a few paths from the left userspace tool "bpftrace" till you get to the tracing infrastructure on the right in kernel space. To get ahold of all the bits and pieces let's start with what kernel offers and how the tools access it. And how BPF tools like bpftrace make tracing more efficient because they can aggregate high-frquency events in kernel space and so don't have to copy every event to user-space.
- bpftrace (https://github.com/iovisor/bpftrace)
- BCC (https://github.com/iovisor/bcc)
- Brendan Gregg Homepage/Blog (www.brendangregg.com)
- (https://git.kernel.org/pub/scm/devel/pahole/pahole.git/)