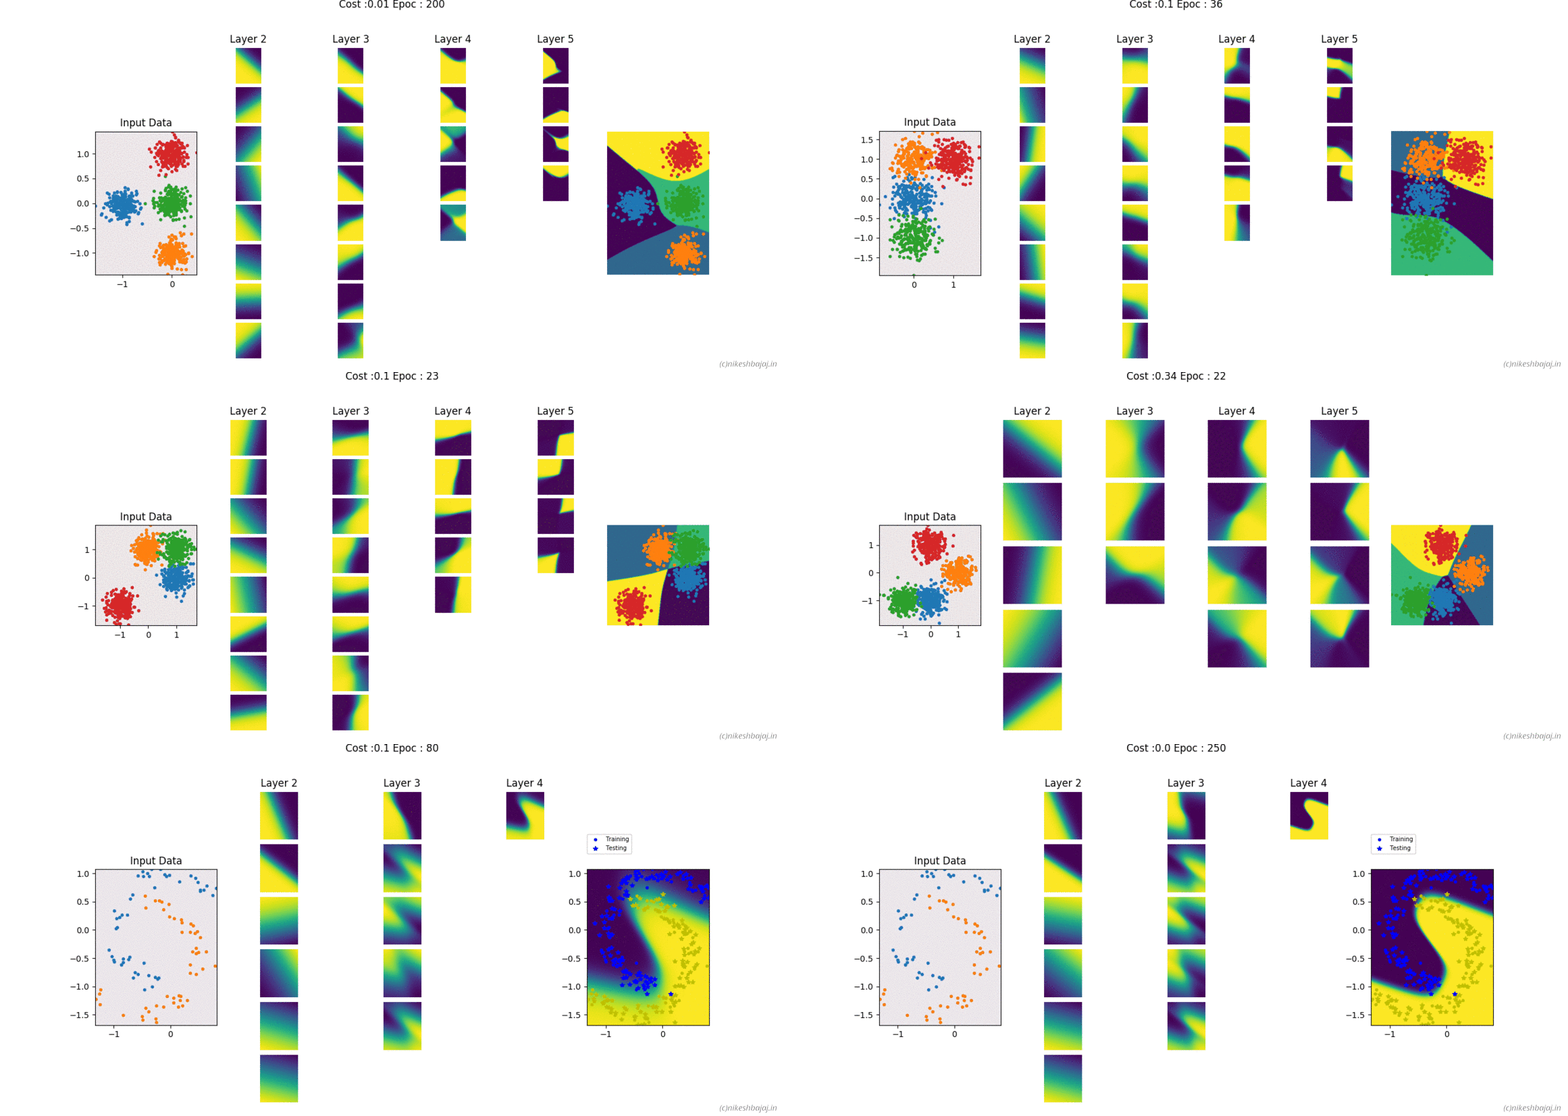
Here is implementation of Neural Network from scratch without using any libraries of ML Only numpy is used for NN and matplotlib for plotting the results
Create same animation yourself - use binder to run the code 
visulization of deep layers are also shown in the examples
- Gradient Decent -Basic one
- Momentum
- RMSprop
- Adam (RMS+ Momentum)
- L2 Penalization
- Dropouts
- Sigmoid, Tanh, ReLu, LeakyReLu, Softmax
- Two class dataset : Gaussian, Linear, Moons, Spiral, Sinasodal
- Multiclass: gaussian distribuated data upto 9 classes
for Two features, deep layers, decesion boundries and Learning curve can be visulize as shown in figures below
import numpy as np
import matplotlib.pyplot as plt
Download DeepNet.py and keep in current directory of your python or cd to folder where you have downloaded these files. If you want to try with simulated dataset then download and DataSet.py also.
from DeepNet import deepNet
import DataSet as ds
You can simulate the toy examples from DataSet library or use your own examples. Important is to remember for DeepNet, dimention of X should be (nf, N), where nf is number of features and N is numbe of examples.
X, y,_ = ds.create_dataset(N =200, Dtype = 'MOONS', noise=0.0,varargin = 'PRESET')
Size of X will be =(2,200) and y =(1,200)
This will generate 200 samples for each class of Moons data with 'PRESET' arguements, you can add noise by fliping the classes of some example, noise takes fractional value to flips the class labels.
type help(ds.create_dataset) for more detail
Network =[3,3]
Two hidden Layers with 3 neurons each, also can be Network =[100, 50, 40, 200] as deep as you like
First and last layer of network will be decided based on dimention of X, and y. Size of first layer = number of features in X (=X.shape[0]), Size of last layer will be 1 if there are two classes else equal to number of classes =(unique values in y)
NetAf = ['tanh','relu']
first layer with tanh and next layer with relu activation function, if you pass only one then by defalut all the hidden layers will have same activation function. Other options for activation functions are Sigmoid sig, Leaky Rectifier Linear Unite lrelu
By default if there are two classes, last layer activation function will be sigmoid for multiclass it will be softmax.
alpha=0.01
miniBatchSize = 0.3
this sets 30% as batch size, if miniBatchSize = 1.0 then there will not be batch processing
AdamOpt=True
if selected AdamOpt=False normal gradiet decent will be effective
B1=0.9
B2=0.99
These parameters can be tuned
lambd =0.5
if set to 0 no L2 regularization will be used
keepProb =[1.0, 0.8, 1.0]
length of keepProb should be either 1 or eaual to number of layers if length of keepProb is 1 same probabilty of dropout will be used for all the layers expcept last layer.
Here is example to create Neural Network
NN = deepNet(X,y,Net = [3,3],NetAf =['tanh'], alpha=0.01,miniBatchSize = 0.3,
            printCostAt =100, AdamOpt=True,B1=0.9,B2=0.99, lambd=0,keepProb =[1.0])
NN.fit(itr=100)
this allows you to train for 100 iteration and do any computation like checking cost, error, decesion boundries etc, as shown in example scripts. then for next 100 iteration just run NN.fit(itr=100)
printCostAt =100 this will print cost after every 100 iterations. To disable set printCostAt =-1 No cost will be printed then
Testing data can also to given to network, Network won't use it for training, it will be only used for computing cost at every iteration for ploting Learning Curve and will also be shown on decesion boundries. By default Xts and yts are set to None
NN = deepNet(X,y,Xts =None, yts =None, ....
yp, ypr = NN.predict(X)
this will give you predicted class in yp and probabilities of all the classes in ypr
NN.PlotLCurve()
This is only if X has two features (X.shape[0]==2)
NN.PlotBoundries()
Plotting Hidden Layers for visulization of hidden low level features learned by Network
This is only if X has two features (X.shape[0]==2)
NN.PlotBoundries(Layers=True)
fig1=plt.figure(1,figsize=(8,4))
fig2=plt.figure(2,figsize=(8,5))

for i in range(20):         ## 20 times
    NN.fit(itr=10)          ## itr=10 iteretion each time
    NN.PlotLCurve(pause=0)
    fig1.canvas.draw()
    NN.PlotBoundries(Layers=True,pause=0) # works only when there are two features (X.shape[0]==2)
    fig2.canvas.draw()


