- Project Purpose:
The purpose of this project was to analyze the difference of Starbucks stores and Dunkin' stores, as they are popular coffee brands and I wanted to see in a sense which one was more popular. I used data from Safegraph selecting the stores in GA. I looked at which of the two brands has more locations on the map and which has more visitors rates on a specific day. The skills I wanted to show was the ability to work with spatial data and having the variety of graphs. This project was for my own personal preference.
- Tools used:
I used R programming for this project and many packages: tidyverse, sf, jsonlite, USAboundaries, leaflet, ggthemes. The final scripts are polygons.R which shows the breaking down of the json tibbles and making the maps of the data and time.R which shows the process of creating the time plots for the average traffic of stores in the data.
- Results:
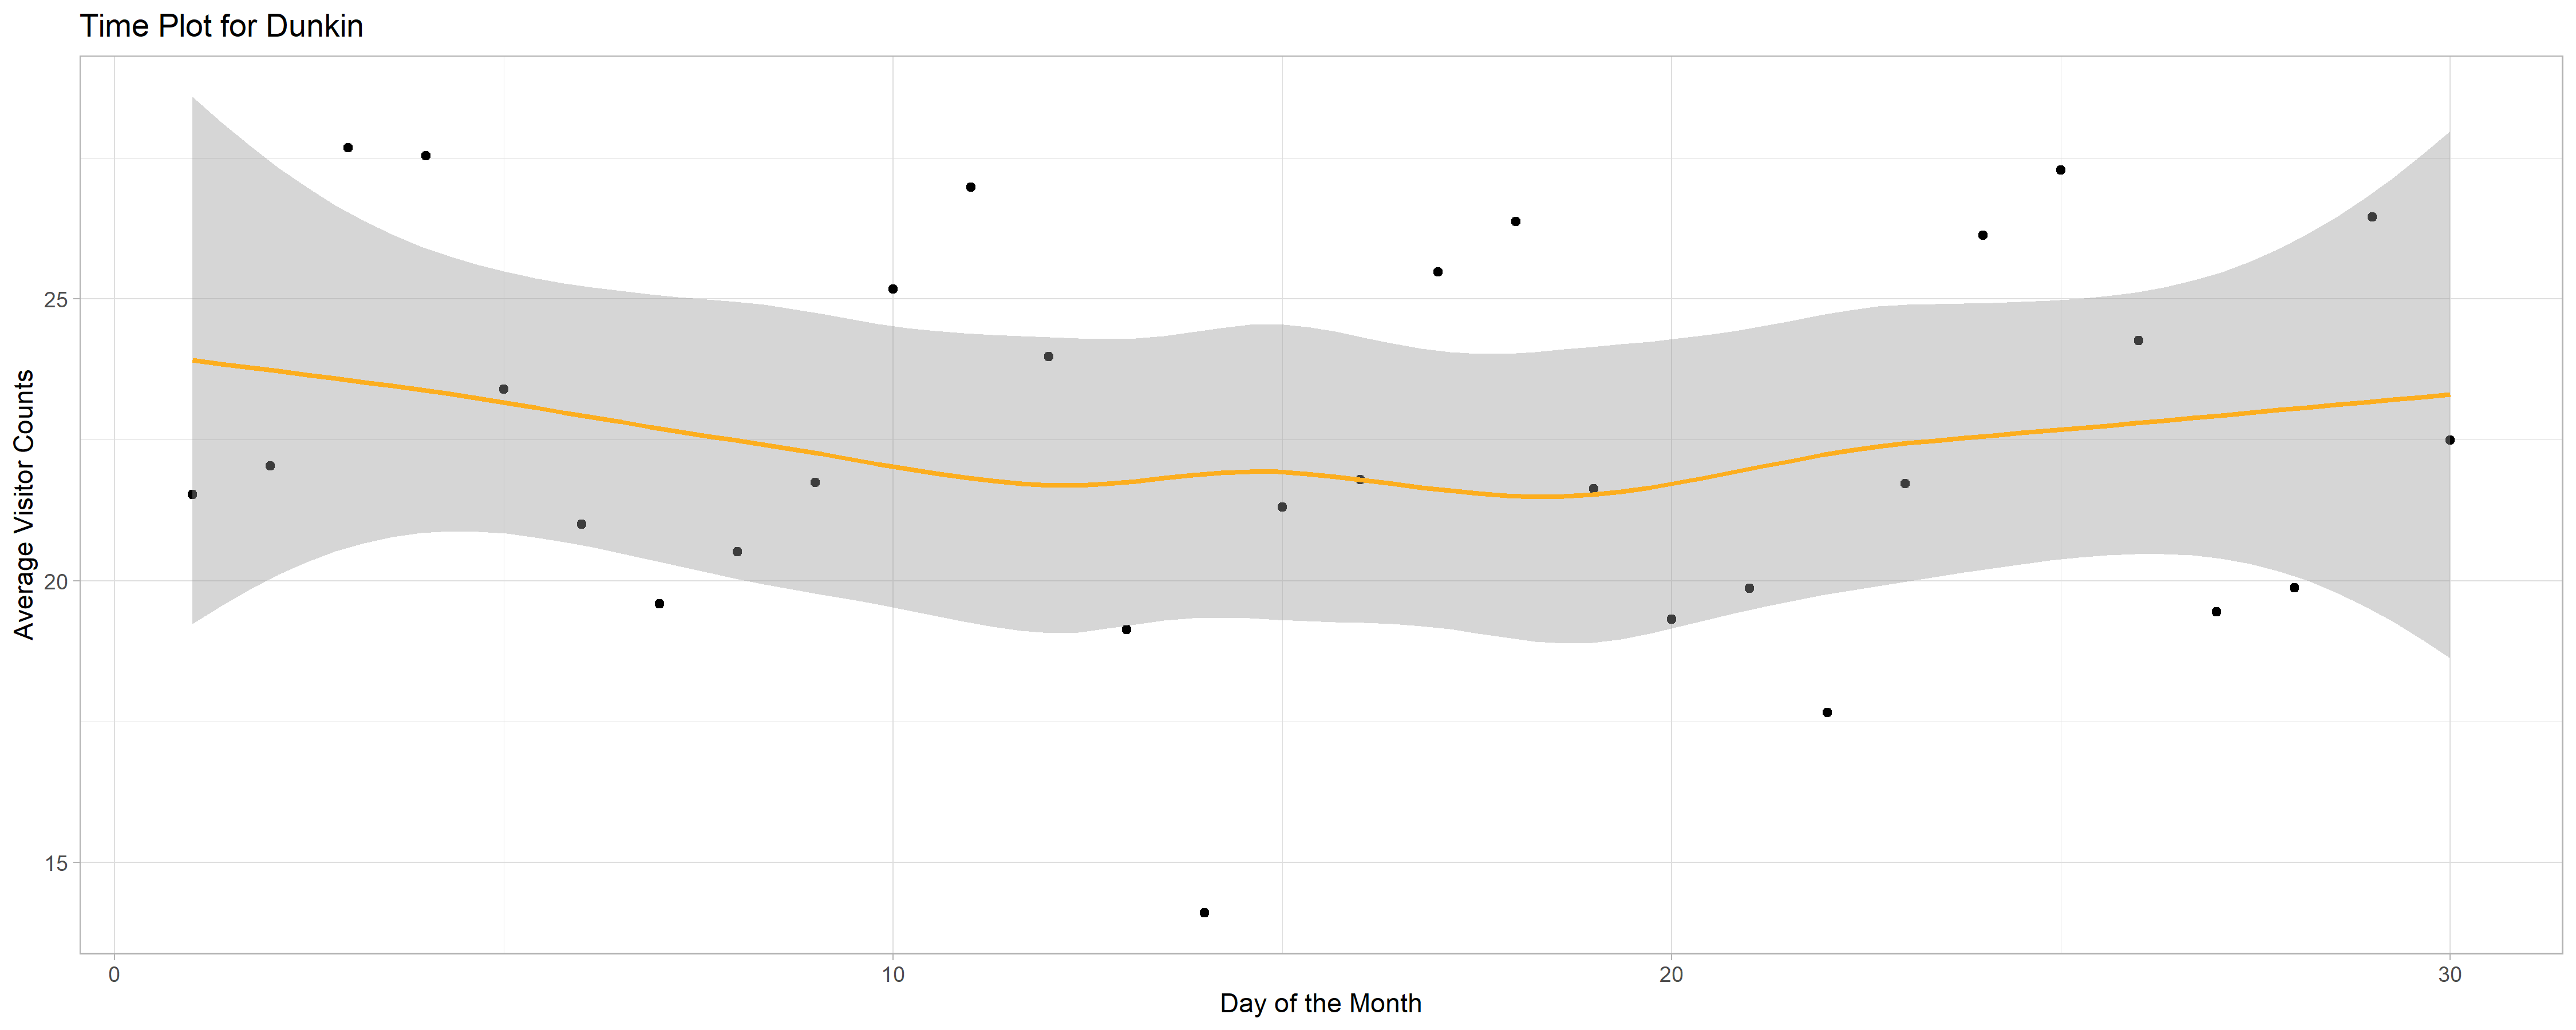
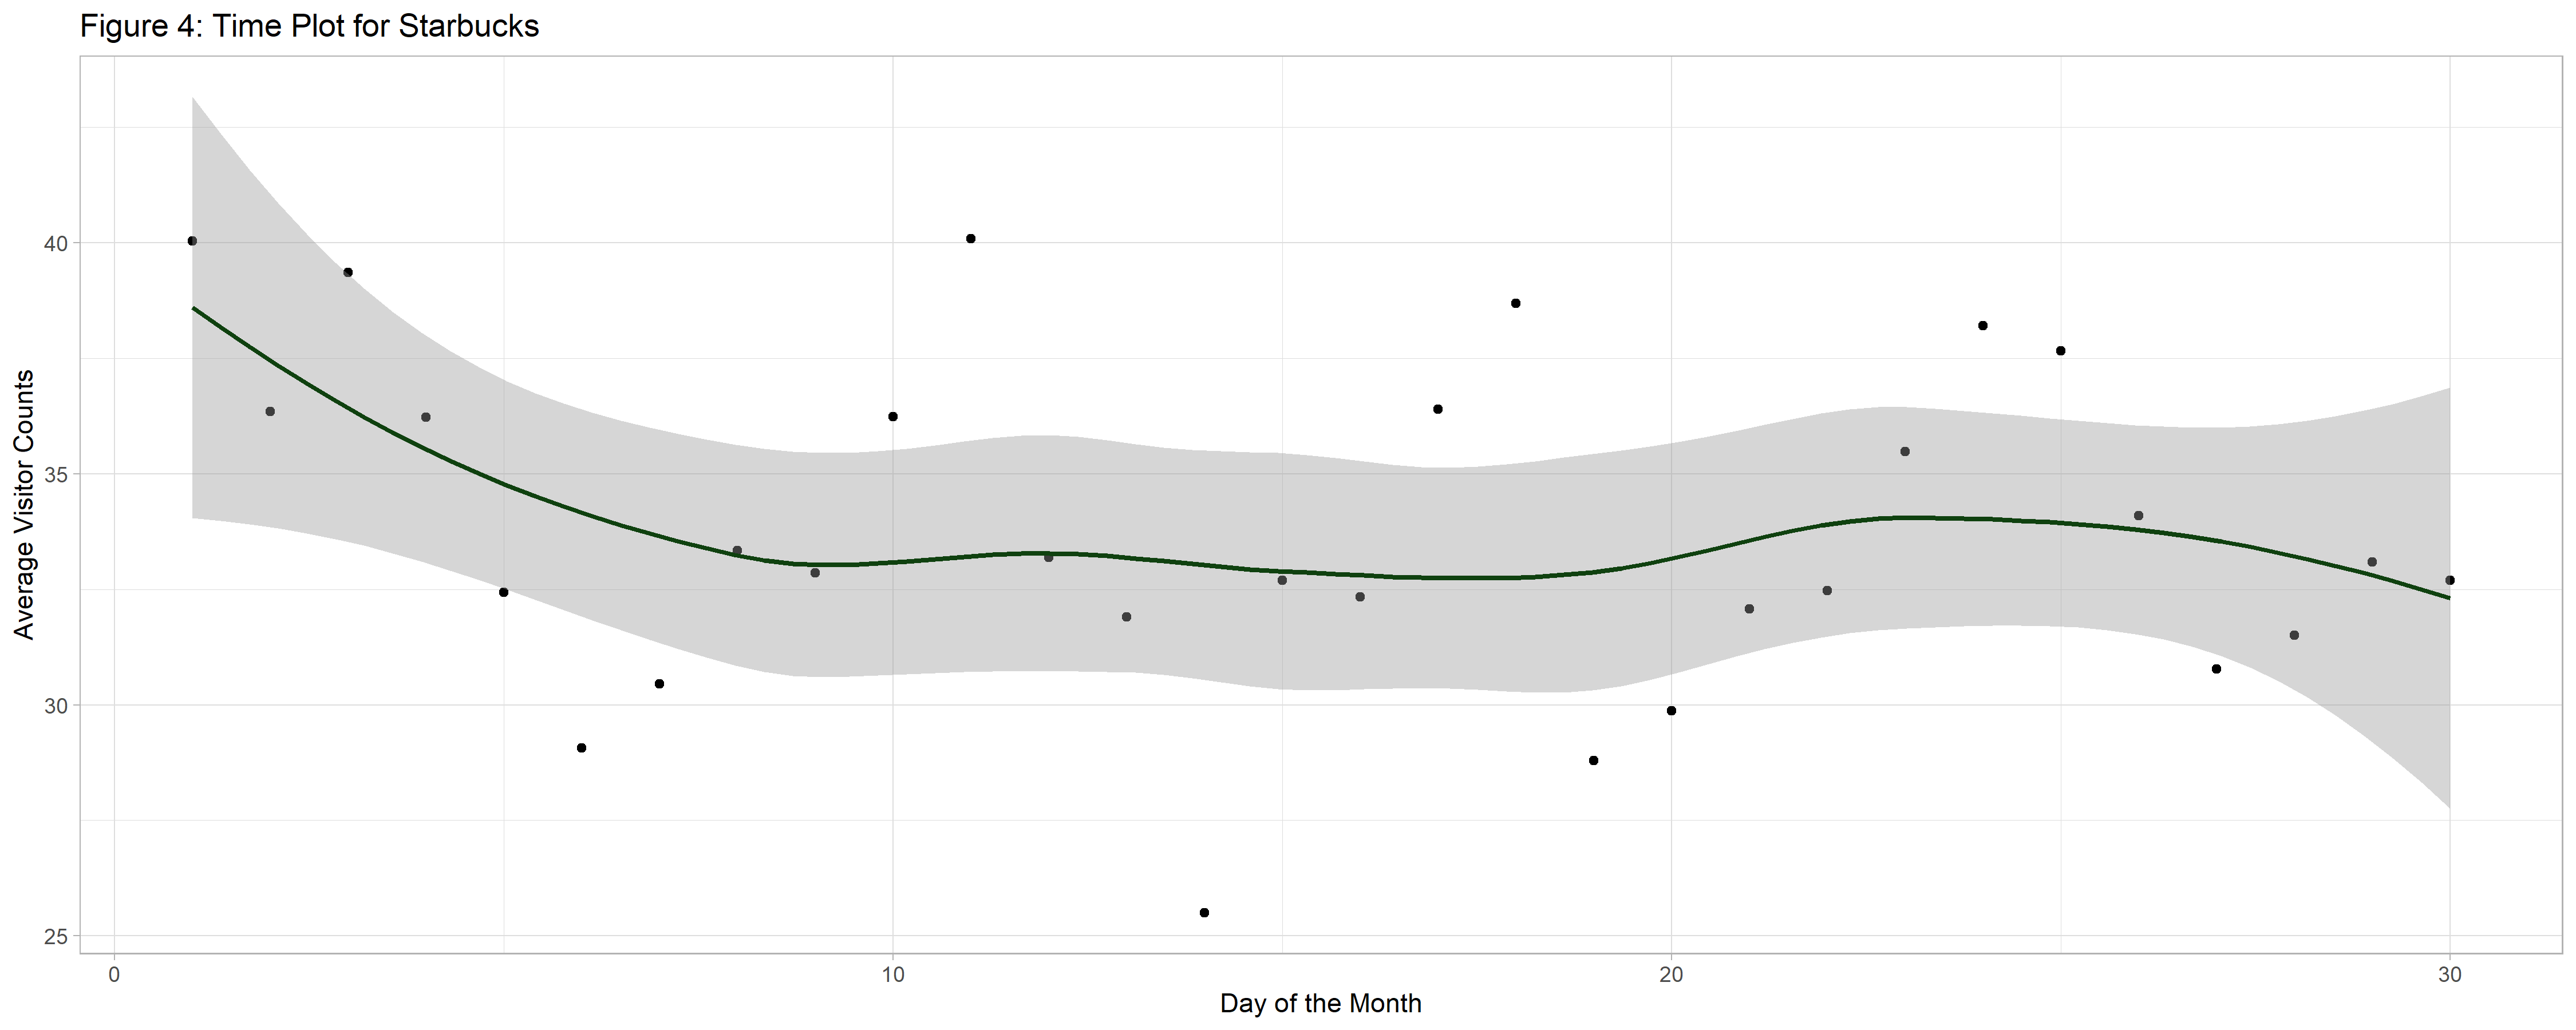 A key finding I saw in the project was analyzing the time plots. Looking at the Dunkin' Plot, you see how the prediction of the average visitor counts is pretty consistent. Whereas looking at the Starbucks Plot, you see a peak in the beginning of the month then slowly decreasing towards the end of the month. But looking at the Starbucks plot, the x axis starts at 25 and goes to 40 where as the Dunkin' only goes up to 25 visitors. In conclusion, more people go to Stabucks on average for the day of Saturday in the week, but Dunkin' has more consistent amount of customers coming in over the month. From experience I think Dunkin is more consistent as their prices are lower than Starbucks and thus more affordable for an everyday coffee, where as even though Starbucks coffee cost more, it is because they have higher quality coffee which more people can tend to enjoy at times during the month.
While looking at the maps of Number of stores and Raw vistior counts for both brands:


I concluded from looking at the scale legends of the two brands that once more, Starbucks is more popular, as they have more stores starting with 25 as base marker compared to 10 for Dunkin'. Starbucks size for the raw visitor counts starts at 2500 visitors opposed to Dunkin' that starts at 500 visitors which is a 133% percent difference. In both maps, it's very intresting to see how both of the brands have many stores all over the state of GA and even in some counties they have multiple stores and have different visitor rates as some of the stores show a bigger point representing mpre people who came to the store.
I think this work matters in the way to see where to have locations of the stores for the owners. For the customers, it can help decide which brand is more popular to make decision which to get their coffee from. My next steps would also look at this data along with the population of the counties; it could help explain why some stores have more activity and also could decide where to put new locations.
- readme.md
- scripts
---- readme.md
---- polygons.R
---- time.R
- data
---- readme.md
---- brand_info.csv
---- core_poi-geometry-patterns.csv
---- GA-Starbucks-Dunkin-CORE_POI-GEOMETRY-PATTERNS-2021_09-2021-11-05.zip
---- home_panel_summary.csv
---- normalization_stats.csv
---- visit_panel_summary.csv
- documents
---- readme.md (notes while doing your project)
---- Average_store_traffic_Dunkin.png
---- Average_store_traffic_Starbucks.png
---- Average_store_traffic.png
---- basic_plot.png
---- Number_of_Dunkin_stores_and_raw_visitor_counts.png
---- Number_of_Starbucks_stores_and_raw_visitor_counts.png
---- Number_of_stores_and_raw_visitor_counts.png
---- Time_plot_Dunkin.png
---- Time_plot_Starbucks.png