This is a small project to provide a web app to generate sample plots given an area of interest.
Webapp: sampleplotter.com

===
| Random | Systematic | Equidistant |
|---|---|---|
 |
 |
 |
sample_type |
Description |
|---|---|
| random | Randomly creates the specified number of points. |
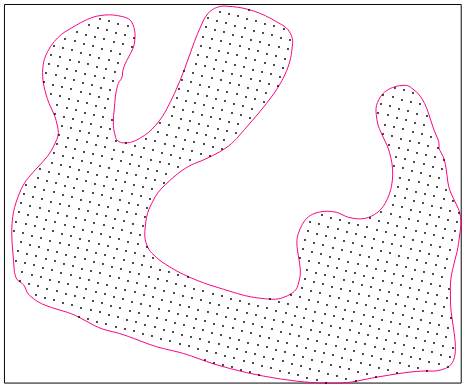
| systematic | Given a target number of points (n), a systematic grid of points is created. A between point distance (d) is calculated to get the total number of points as close to n as possible. Initial point is randomly chosen between 0 and d for both x and y axes. |
| equidistant | Given a number of points (n), a systematic triangular grid of points is created. Points are equidistant from each other. A between point distance (d) is calculated to get the total number of points as close to n as possible. Initial point is randomly chosen between 0 and d for both x and y axes. |
If "check_topology" is on, as close to n points as possible will be created only within study area.
| Random | Systematic | Equidistant |
|---|---|---|
 |
 |
 |
Rotation in degrees of point array in counter-clockwise direction about extent center.
| Systematic | Equidistant |
|---|---|
 |
 |